神经退行性病
-
Figure 1|Animal experimental procedure diagram.
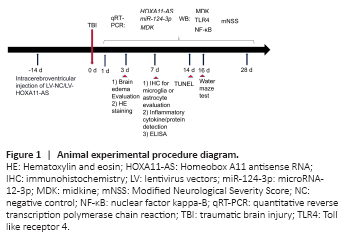
The Animal Experiment Center of Southwest Medical University (license No. SCXK (Chuan) 2018-17) supplied 120 male Sprague-Dawley rats (8–10 weeks old, weight 220–250 g, specific-pathogen-free level) and 40 newborn Sprague-Dawley rats (weight 5–8 g, specific-pathogen-free level). Adult rats were housed in cages with ad libitum access to food and water, an ambient temperature of 20–25°C and a humidity of 50–52%, and a 12-hour light and 12-hour dark cycle. Animals had no access to food and water 12 hours before surgery. The adult rats were randomly divided into four groups, namely the sham (n = 10), TBI (n = 50), TBI + LV-NC (n = 30), and TBI + LV-HOXA11-AS groups (n = 30). The experimental design is shown in Figure 1. The Animal Protection and Use Committee of Southwest Medical University approved the experiment (approval No. SMU-2019-042) on February 4, 2019.
Figure 2|Expression characteristics of HOXA11-AS, miR-124-3p, and MDK in the injured cortex of TBI rats.
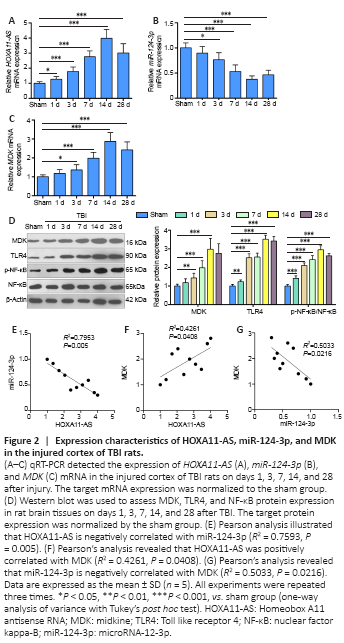
We constructed a TBI rat model and performed qRT-PCR to evaluate the expression of HOXA11-AS, miR-124-3p, and MDK in TBI on days 1, 3, 7, 14, and 28. HOXA11-AS was upregulated in TBI rats (P < 0.05, Figure 2A), and miR-124-3p expression was decreased and reached its minimum on the 14th day (P < 0.05, Figure 2B) compared with the control group. Western blot and qRT-PCR revealed that MDK mRNA and protein expression was upregulated compared with the control group (P < 0.05; Figure 2C and D). According to the Pearson’s analysis, miR-124-3p was negatively correlated with HOXA11-AS (R2 = 0.7593, P = 0.005) and MDK (R2 = 0.5033, P = 0.0216), while HOXA11-AS was positively correlated with MDK (R2 = 0.4261, P = 0.0408; Figure 2E–G). These results indicated that HOXA11-AS, miR-124-3p, and MDK all play a role in TBI.
Figure 3|HOXA11-AS overexpression aggravates brain edema, cognitive impairment, and neuronal apoptosis in TBI rats.
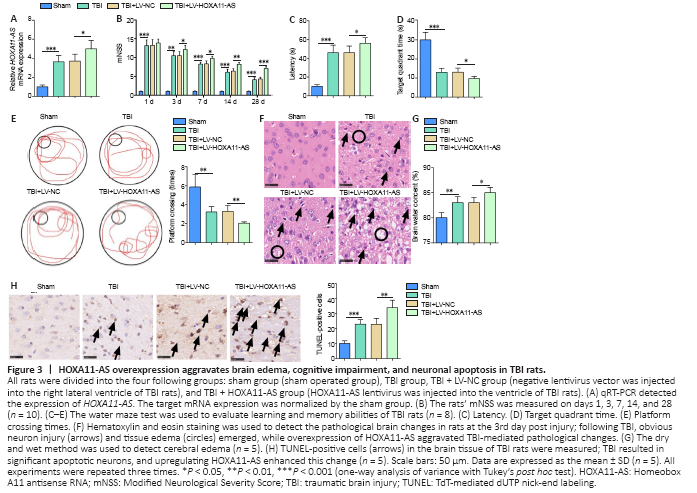
To explore the effect of HOXA11-AS on TBI rats, we constructed a rat model with an overexpression of HOXA11-AS, which was subsequently verified by qRT-PCR to be highly expressed in rat brain tissues (Figure 3A). Moreover, we assessed the neurological functions of rats by mNSS and water maze test. The mNSS of rats in the TBI group was significantly higher compared with the sham group (P < 0.05; Figure 3B). The latency period of TBI rats to find the platform in the water maze test was prolonged, and the residence time of rats in the platform quadrant and the frequency they crossed the platform were lower than those in sham group rats (P < 0.05; Figure 3C–E). Nevertheless, HOXA11-AS upregulation increased the mNSS of TBI rats, enhanced the time spent searching for the platform, reduced the residence time of rats in the platform quadrant, and reduced the frequency of platform crosses (P < 0.05; Figure 3B–E). On the third day after modeling, the rats’ brain water content was measured using the dry and wet method and hematoxylin and eosin staining. The brain water content was significantly higher in the TBI rats compared with the sham group, which was further aggravated by HOXA11-AS upregulation (P < 0.05; Figure 3F–G). Finally, TUNEL staining was used to identify cell apoptosis. Compared with the sham group, the number of TUNEL-positive cells in the TBI group increased remarkably, while overexpression of HOXA11-AS resulted in a further increase in TUNEL-positive cells (P < 0.05; Figure 3H). These results indicated that overexpression of HOXA11-AS aggravated the neurological deficits of TBI rats.
Figure 4|HOXA11-AS increases microglia activation and the inflammatory response in TBI rats.
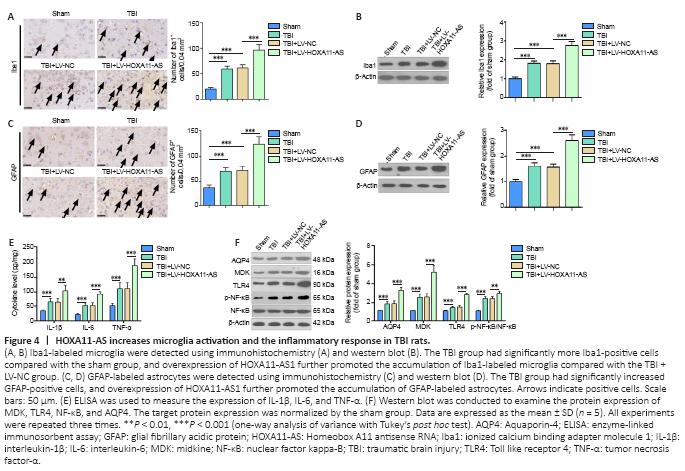
Multiple studies have shown that neuroinflammation is a major secondary injury mechanism of TBI (Long et al., 2020). First, Iba1-labeled microglia and GFAP-labeled astrocytes in brain tissues of TBI rats were detected via immunohistochemistry and western blot. Compared with the sham group, numbers of Iba1-positive microglia and GFAP-positive astrocytes were significantly higher in the TBI group, and this effect was further increased by HOXA11-AS overexpression (P < 0.05, Figure 4A–D). Second, the levels of IL-1β, IL-6, and TNFα were verified by enzyme-linked immunosorbent assay. We found that all of the inflammatory cytokines were upregulated in the TBI group. When HOXA11-AS was upregulated, IL-1β, IL-6, and TNF-α were further upregulated in the TBI + LV-HOXA11-AS rats (P < 0.05, vs. TBI group; Figure 4E). Finally, western blot was used to detect MDK and AQP4, and their expression in the TBI group was upregulated, while MDK and AQP4 levels in the HOXA11-AS group were even more increased (compared with the sham group) (P < 0.05, Figure 4F). These results suggest that the overexpression of HOXA11-AS increased microglia and astrocyte activation and the release of inflammatory factors following TBI lesions.
Figure 5|Activated microglia promote the activation astrocytes.

We performed immunofluorescence to detect microglial activation (labeled by OX42). We found that OX42 expression in microglia cells significantly increased after LPS stimulation (P < 0.05, Figure 5A). In addition, qRT-PCR results illustrated elevated expression of TNF-α, IL-1β, and IL-6 in microglia (Figure 5B), and the protein levels of MDK, TLR4, and phosphorylated NF-κB in microglia were also upregulated after LPS treatment (P < 0.05; Figure 5C and D). We then used the microglial culture medium to incubate with the primary astrocytes, and found that the condition medium from microglia in the LPS group induced remarkable activation of astrocytes (labeled by GFAP staining) (P < 0.05; Figure 5E). The mRNA levels of IL-1β, IL-6, and TNF-α in astrocytes were also upregulated by LPS, and even more upregulated by LPS-treated medium from microglia (Figure 5F). Finally, western blot was used to examine MDK, AQP4, and TLR4/NF-κB expression in astrocytes. The results revealed that LPS promoted MDK, AQP4, and TLR4/NF-κB expression in astrocytes. Medium from microglia in the LPS group had even more significant effects in promoting those proteins (Figure 5G). These results indicate that LPS-activated microglia led to the activation of astrocytes by upregulating MDK-TLR4/NF-κB and inflammatory factors.
Figure 6|Functions of HOXA11-AS/miR-124-3p in regulating the microglia-induced activation of astrocytes.
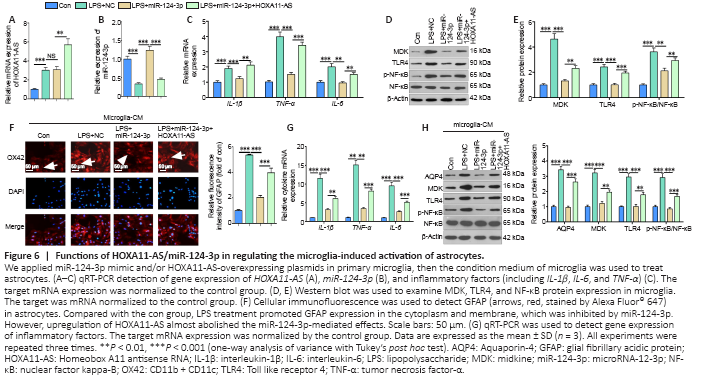
MiR-124-3p mimic and/or HOXA11-AS overexpressing plasmids were transfected into microglia. qRT-PCR was used to detect gene expression, and revealed that HOXA11-AS was enhanced by LPS, while miR-124-3p had low expression levels in the LPS group compared with the control group (Figure 6A and B). However, miR-124-3p levels in the LPS + miR-124-3p + HOXA11-AS group were low compared with the LPS + miR-124-3p group (Figure 6B). Next, the inflammatory responses in microglia were assessed. The results indicated that overexpression of miR-124-3p inhibited LPS-induced proinflammatory cytokines and MDK and TLR4/NF-κB expression, while upregulation of HOXA11-AS mostly attenuated miR-124-3p-mediated effects (Figure 6C–E). The microglia-astrocyte interaction was also examined; compared with the LPS + miR-NC group, GAFP expression in astrocytes was significantly reduced after the upregulation of miR-124-3p (Figure 6F). In addition, the expression of TNF-α, IL-1β, and IL-6 in astrocytes was evaluated using qRT-PCR, and revealed that overexpressing miR-124-3p in microglia significantly reduced the expression of IL-1β, IL-6, and TNF-α in astrocytes (Figure 6G). Furthermore, the expression of MDK, TLR4/NF-κB, and AQP4 in astrocytes was also significantly reduced following the upregulation of miR-124-3p (Figure 6H). Consistent with the results in microglia, upregulation of HOXA11-AS abolished miR-124-3p mimic-mediated anti-inflammatory functions in astrocytes (Figure 6F–H). These findings indicate that overexpression of miR-124-3p alleviated the activated microglia-mediated inflammatory response in astrocytes.
Figure 7|Downregulation of MDK attenuates the microglia-induced activation of astrocytes.
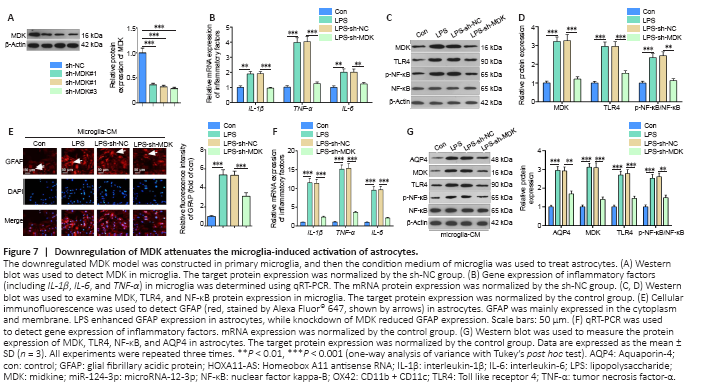
To further clarify how MDK regulates microglia and astrocyte activation, we constructed a MDK-downregulated cell model in microglia (Figure 7A), which was then treated with LPS. Compared with the LPS + sh-NC group, TNF-α, IL-1β, IL-6, MDK, TLR4, and phosphorylated NF-κB levels declined significantly in the LPS + sh-MDK group (Figure 7B–D). Next, we treated astrocytes with medium derived from microglia. We found that astrocytic activation (labeled by GFAP), the levels of TNF-α, IL-1β, and IL-6, and protein expression of MDK, AQP4, TLR4, and phosphorylated NF-κB in astrocytes were all reduced compared with those seen in the LPS + sh-NC group (Figure 7E–G). Therefore, downregulation of MDK repressed microglia-induced astrocyte activation.
Figure 8|miR-124-3p is the target of HOXA11-AS and MDK.

We browsed StarBase to identify potential target genes of HOXA11-AS, which revealed that HOXA11-AS targets miR-124-3p, and MDK is a potential target of miR-124-3p (Figure 8A). To determine the relationship between the three molecules, we conducted a dual-luciferase reporter gene experiment. The results indicated that miR-124-3p mimic notably decreased the luciferase activity of BV2 microglial cells transfected with HOXA11-AS-WT and MDK-3?-UTR-WT, but had no significant effect on the luciferase activity of mutant HOXA11-AS (HOXA11-AS-MUT) or MDK (MDK-MUT) (Figure 8B and C). Furthermore, to clarify the relationship between HOXA11-AS, miR-124-3p, and MDK, a RNA immunoprecipitation experiment was conducted. After transfection of miR-124-3p mimic in BV2 microglia cells, HOXA11-AS and MDK levels were both higher in the Ago2 antibody group compared with the IgG group, which suggests that HOXA11-AS and MDK bind to the Ago2 protein through miR-124-3p (Figure 8D and E). Taken together, these two experiments confirmed that HOXA11-AS sponged miR-124-3p, which then targeted the 3?-untranslated region of MDK.