视神经损伤
-
Figure 2|Effects of various lutein doses on photoreceptor cell layer in Pde6brd10 (rd10) mice at postnatal day 26.
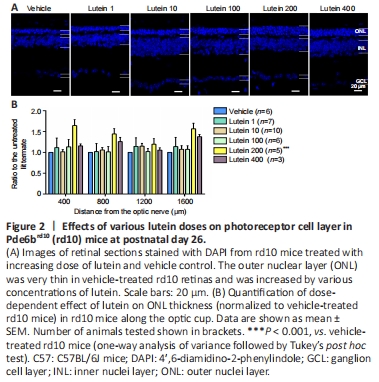
We first estimated photoreceptor survival by measuring the thickness of the ONL of the retina, where the photoreceptor somas are located. We tested five doses of lutein (1, 10, 100, 200, and 400 mg/kg body weight) to screen for the optimal therapeutic concentration required to protect the retina. DAPI was used to label the nuclei in each layer of the retina. The thickness of the ONL in rd10 mice increased to varying degrees after oral gavage with lutein (Figure 2A). A dose of 200 mg/kg increased the thickness from the center to the periphery (P < 0.001, compared with vehicle-treated littermates), with the most significant difference at 400 μm from the optic nerve center (Figure 2B).
Figure 3|Lutein partially rescues photoreceptor cells in the retina in Pde6brd10 (rd10) mice at postnatal day 26.
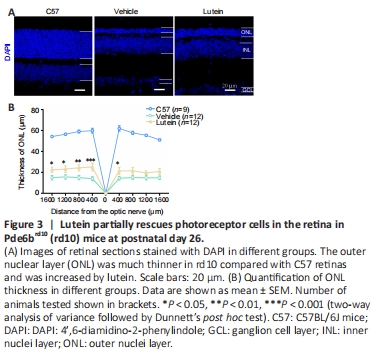
Subsequent experiments were therefore carried out using lutein at 200 mg/kg, withC57 mice as the wild-type (WT) control. Lutein markedly delayed photoreceptor degeneration at day 9 after treatment, as demonstrated by the increased thickness of the ONL (Figure 3A). The increased ONL thickness was most evident in the central retina at ±400 μm from the optic nerve (Figure 3A). The ONL thickness in C57 mice was 60 ± 2.30 μm (n = 9) and this was reduced to 14 ± 1.94 μm in vehicle-treated rd10 mice (n = 12). However treatment with lutein significantly increased the thickness of the ONL in rd10 mice to 25 ± 3.68 μm (n = 12, P < 0.001, vs. vehicle control group; Figure 3B).
Figure 4|Lutein protects retinal structure in Pde6brd10 (rd10) mice at postnatal day 26.
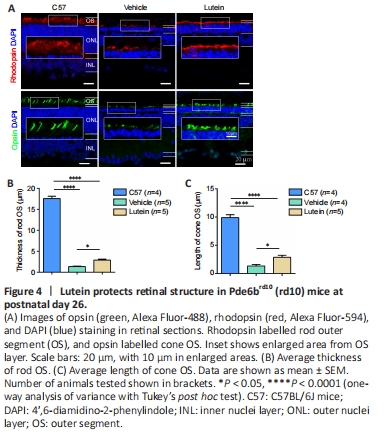
Rhodopsin and opsin are light-sensitive proteins expressed by the OS of rod and cone cells, respectively (Carroll et al., 2012; Makino et al., 2012). We therefore used rhodopsin immunostaining to confirm the molecular structure of the rods. The rod OS were clearly stained in control C57 mice, with a thickness of 17.56 ± 0.58 μm (n = 4) (Figure 4A top panel, left). In contrast, most of the rod OS had degenerated in vehicle-treated rd10 mice and the OS layer was reduced to 1.36 ± 0.12 μm (n = 5) (Figure 4A top panel, middle). Lutein treatment increased the expression of rhodopsin in the rod OS (Figure 4A top panel, right) and increased the OS thickness to 2.90 ± 0.23 μm (n = 5; P < 0.05, vs. vehicle control group; Figure 4B). These results were consistent with those of nuclear staining indicating more somas in the ONL. Lutein treatment thus slowed down the degeneration of rd10 rods.
Figure 5|Lutein enhances visual behavior in Pde6brd10 (rd10) mice at postnatal day 25.
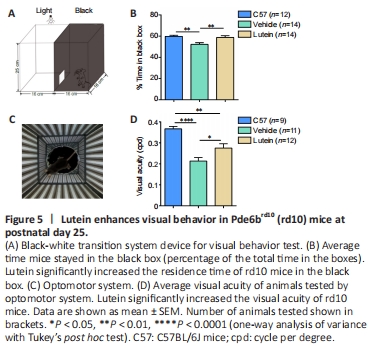
The morphological improvements induced by lutein were further testified by visual behavior. We used the black-white box system (Figure 5A) to estimate the tendency of mice to stay in the dark. Due to their nocturnal characteristics, C57 mice with normal vision tended to stay longer in in the black box compared with the white box. However, rd10 mice lost the ability to distinguish between light and dark, in line with the degeneration of their photoreceptor cells, causing them to spend more-equal amounts of time in the black and white boxes. Vehicle-treated rd10 mice (n = 14) spent 52.3 ± 1.5% of their time in the black box, compared with 59.9 ± 0.9% in the normal group (n = 12; P < 0.01). After oral administration of lutein, the time spent by rd10 mice in the black box increased to 58.9 ± 1.6% (n = 14, P < 0.01, vs. vehicle control group; Figure 5B). These results suggested that lutein could improve the ability of rd10 mice to distinguish between light and dark.
We also tested the visual acuity of the mice using an optomotor system, which encircled the mouse with computer screens displaying moving gratings at various spatial frequencies (Figure 5C). The maximum frequency of a grating that a mouse could follow by its head movement was defined as the visual acuity. The visual acuity of C57 mice was 0.37 ± 0.01 cpd (n = 9), compared with 0.21 ± 0.02 cpd in vehicle-treated rd10 mice (n = 11; P < 0.0001). Lutein treatment significantly improved the visual acuity of rd10 mice to 0.27 ± 0.02 cpd (n = 12; P < 0.05 vs. vehicle control group), though it remained lower than in C57 mice (P < 0.01; Figure 5D). These visual acuity results confirmed that lutein improved visual function in rd10 mice.
Figure 6|Lutein improves the light responses of Pde6brd10 (rd10) retina at postnatal day 26.
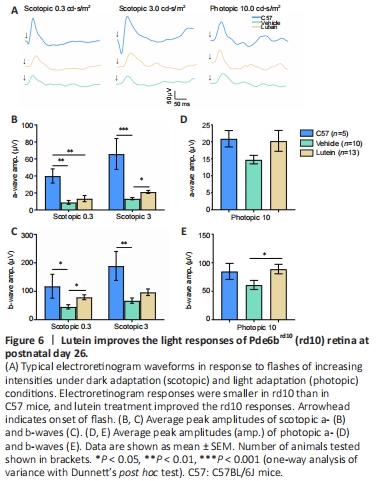
After confirming the protective effect of lutein on the visual behavior of rd10 mice, we further examined the functional characteristic of the retina by ERG. Retinal neurons responded strongly to light flashes under scotopic (dark-adapted) and photopic (light-adapted) conditions in C57 mice (black lines, Figure 6A). In contrast, light responses in rd10 mice decreased significantly for all tested flash intensities (blue lines), and lutein treatment partially rescued these response (red lines, Figure 6A).
Most vehicle-treated rd10 mice (7/10, 70%) failed to respond to light stimuli with a clear waveform under scotopic conditions with a low flash intensity at 0.03 cd·s/m2, while lutein treatment reduced the non-responsive rate to 28.5% (4/14, 28.5%). Small ERG responses were observed in all rd10 mice at flash intensities of 0.3 and 3.0 cd·s/m2, which were significantly smaller than those in C57 mice (Figure 6B and C). Under dark adaptation conditions, lutein enhanced both the a- and b-wave amplitudes in rd10 mice. Specifically, lutein significantly increased the b-wave amplitude from 45 ± 7.5 μV in vehicle-treated rd10 mice (38% of WT) to 79 ± 8.5 μV (67% of WT) at scotopic 0.3 cd·s/m2 (P < 0.05, vs. vehicle control group; Figure 6C), and increased the a-wave amplitude from 13 ± 1.3 μV (20% of WT) to 22 ± 1.8 μV (32% of WT) at scotopic 3 cd·s/m2 (P < 0.05, vs. vehicle control group; Figure 6B). After light adaptation, lutein increased the a-wave amplitude slightly but not significantly (P = 0.2596, vs. vehicle control group; Figure 6D), and significantly raised the b-wave amplitude from 55 ± 9.1 μV to 90 ± 10.0 μV (P < 0.05, vs. vehicle control group; Figure 6E).
Figure 7|Lutein prevents the progression of reactive gliosis in the Pde6brd10 (rd10) retina at postnatal day 26.
 Given that lutein has an anti-inflammatory effect (Chung et al., 2017), we determined if it inhibited inflammation in the rd10 retina. Reactive gliosis in Müller cells and microglia in the retina is an indicator of inflammation, with increasing expression of GFAP in Müller cells and reactivity of microglia cells (Bringmann and Wiedemann, 2012; Genové et al., 2014). We first examined the immunopositivity of GFAP in Müller cells by counting the number of Müller glial cells and measuring the length of their processes. Müller cells were not activated in C57 mice and GFAP immunopositivity was limited to the ganglion cell layer, with extremely short dendrites (Figure 7A top panel, left). In contrast, Müller glial cells were much more active in vehicle-treated rd10 mice, with more processes expressing GFAP and the GFAP-positive processes extending to the ONL layer (Figure 7A). The mean fluorescence intensity of GFAP staining significantly increased 2.16 ± 0.16-fold compared with C57 mice (P < 0.05; Figure 7B). Lutein treatment significantly weakened the reactive gliosis of Müller cells, with fewer and shorter GFAP-stained processes (Figure 7A). The mean fluorescence intensity of GFAP was significantly reduced to 1.22 ± 0.17-fold that in C57 mice (P < 0.05 vs. vehicle; Figure 7B). We also analyzed the number and length of GFAP-positive processes, and found that both were significantly increased in the vehicle-treated group and both were significantly reduced by lutein (data not shown).
We measured the reactivity of microglial cells by Iba-1 staining. Iba-1-labelled microglia in C57 mice had branches mainly in the inner retina (Figure 7A), while the microglia extended all over the retina in vehicle-treated rd10 mice, with many in the outer layers, with thick branches and large somas (Figure 7A). The mean fluorescence intensity increased significantly to 3.26 ± 0.27-fold that in C57 mice (P < 0.01, vs. C57; Figure 7C). Lutein reduced the numbers of microglia in the outer and inner retinas (Figure 7A), but only decreased the average Iba-1 fluorescence intensity slightly to 3.04 ± 0.21-fold of that in C57 mice (P < 0.01, vs. C57), which was not significantly lower than that in the vehicle group (P = 0.53, vs. vehicle group). These results imply that lutein inhibited the gliosis of Müller cells but had less effect on microglia in the rd10 retina.
点击此处查看全文