脑损伤
-
Figure 1|Successful establishment of a BSH model.

In the BSH group, the rat mortality rates were 21%, 33%, and 55% on days 1, 3, and 7, respectively, values that are similar to the high mortality rates reported in human studies, which range from 58% to 61% (Wijdicks and St Louis, 1997; Balci et al., 2005; Matsukawa et al., 2015; Meguro et al., 2015; Tao et al., 2016a). Approximately 84% of the rats in the BSH group exhibited evident neurobehavioral deficits. In addition, in the gross samples (Figure 1A) and coronal brain section tissue (Figure 1B) acquired on day 3, a hematoma was observed in the right pontine in the animals in the BSH group (white arrow), but not in those in the sham group. Consistent with this, typical hemorrhagic lesions were also noticed in the right pontine in the coronal hematoxylin-eosin stained images (Figure 1C and D).
Figure 5|Hematoxylin and eosin staining of brainstem hemorrhage from day 1 to day 7.
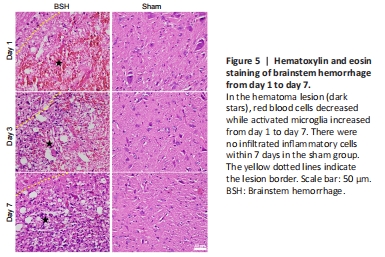
On the hematoxylin-eosin-stained sections (Figure 5), a slightly-stained region around the border of the hematoma (the yellow dashed line) consisting of pericellular vacuolization, demyelinated axons, swelling neurons, and mass-activated microglia was observed around the hematoma region. From the time of modeling to day 7, a growing number of inflammatory cells, such as microglial cells, gathered and migrated from the border to the center of the hematoma, and erythrocytes were gradually cleared up until they had totally disappeared. On days 3 and 7, when the tissue around the hematoma changed to a loose nature and edema was largely seen around the necrosis area, the hematoma region was replaced with activated microglia that were revealed to be gitter cells because of their phagocytosis of cell debris such as erythrocytes in the necrotic region. In the sham group, the morphology of the neurons and other glial cells was normal, and no infiltration of inflammatory cells was observed within 7 days.
Figure 6| Luxol fast blue-Nissl staining and fractional anisotropy analysis in BSH.
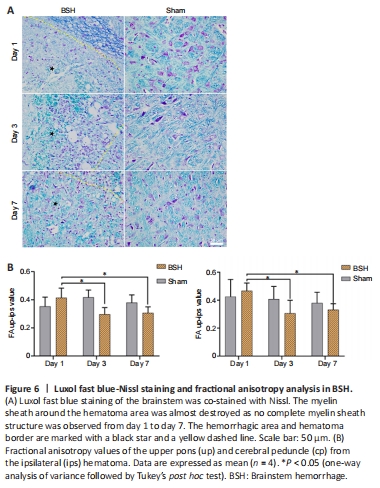
The temporal patterns of LFB and Nissl staining on brainstem slices are shown in Figure 6A. The normal myelin sheath of the axon was easily stained by LFB, whereas the injured myelin sheath was little stained. The structure of the normal nerve fiber bundle on LFB-stained images is a round or oval blue disk within which there are several vacuoles formed by a little-stained axon. In the BSH group, the myelin sheath was almost destroyed within or around the hematoma area, and no complete myelin sheath structure was observed from days 1 to 7. Under the Nissl staining, the neurons in the sham group showed a clear and intact structure, while those in the BSH group showed severe structural damage around the hematoma.
In addition to the LFB staining, the integrity and continuity of the brainstem nerve fibers were observed by DTI. The DTI data were acquired from image sections of the upper pons and cerebral peduncle near to the hematoma. Lowered FA values were found in the ipsilateral hematoma on the brainstem on days 3 and 7 (P < 0.05, vs. day 1) in the BSH group (Figure 6B). In the upper pons and cerebral peduncles, the decreased FA values represented injury of nerve fibers in the brainstem, which is in line with the results of the LFB staining.
Figure 7|Fluoro-Jade C staining and analysis in BSH.
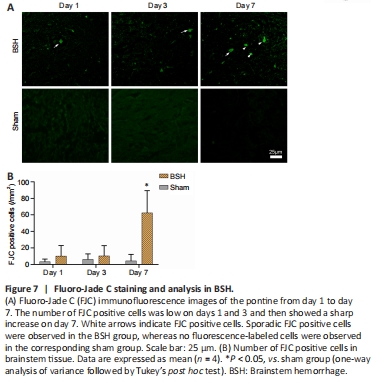
FJC staining was used to investigate neuron degeneration. As shown in Figure 7, the induced hematoma of the pontine not only damaged white matter and the surrounding region but also caused neuron injury and degeneration (Gutiérrez et al., 2018; Jiang et al., 2019). Typical and scattered FJC-positive cells were visualized around the hematoma under fluorescence microscopy. As expected, no specific labeled neurons were encountered in the sham group or contralateral hematoma (Figure 7A). On days 1 and 3, the numbers of FJC-positive cells were considerably lower than the sharply increased number present on day 7. Generally, the number of specific labeled neurons in the BSH group was higher than that in the sham group from day 1 to day 7 (Figure 7B).
Figure 8| IL-1β and TNF-α in the brainstem after BSH.

The expression of inflammatory cytokines such as IL-1β and TNF-α around the hematoma was detected by immunohistochemical staining. The immunopositivities of two inflammatory cytokines, IL-1β and TNF-α, are shown in Figure 8. Both of these were produced on the first day after BSH, peaked on day 3, and had then decreased on day 7. However, the expression levels of IL-1β and TNF-α at the beginning were slightly different from those on day 7; in other words, IL-1β was more highly expressed on day 1 than on day 7, while the expression of TNF-α showed the opposite pattern.