脑损伤
-
Figure 2|H-NSC proliferation and neuronal differentiation deficits in DM-tGCI/R mice.
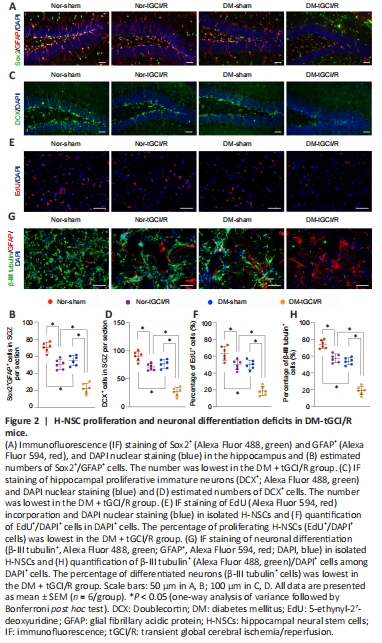
H-NSCs play a crucial role in maintaining and restoring cognition (Toda and Gage, 2018). Their decline thus directly reduces neuroplasticity and cognitive function, while their proliferation and neurogenesis help restore hippocampal structure and function (Hu et al., 2020). We therefore calculated the numbers of H-NSCs (Sox2+/GFAP+) and newly generated immature neurons (DCX+) in the subgranular zone (SGZ) of mice in the four groups, as described previously (Hu et al., 2021). The numbers of Sox2+/GFAP+ cells and DCX+ cells were higher in Nor + sham mice compared with Nor + tGCI/R, DM + tGCI/R, and Nor + sham mice, and the numbers of Sox2+/GFAP+ cells and DCX+ cells were lower in DM + tGCI/R mice compared with Nor + sham and Nor + tGCI/R mice (Sox2+/GFAP+: P = 0.0001 for DM + tGCI/R vs. Nor + tGCI/R; DCX+: P = 0.0001 for DM + tGCI/R vs. Nor + tGCI/R; Figure 2A–D). We also isolated H-NSCs from mice in the four groups and compared their proliferation and neuronal differentiation abilities in vitro. The percentage of proliferating H-NSCs (EdU+/DAPI+ cells) was higher in the Nor + sham group compared with the other three groups and lower in the DM + tGCI/R group compared with the Nor + tGCI/R and DM + sham groups (P = 0.0001 for DM + tGCI/R vs. Nor + tGCI/R; Figure 2E and F). After induction, the percentage of differentiated neurons (β-III tubulin+ cells) was significantly higher in the Nor + sham group compared with the Nor + tGCI/R, DM + sham, and DM + tGCI/R groups, and was lowest in the DM + tGCI/R group (P = 0.0001 for DM + tGCI/R vs. Nor + tGCI/R; Figure 2G and H). These results indicated that the proliferation and neuronal differentiation capacities of H-NSCs were decreased in mice after exposure to DM or tGCI/R injury. H-NSC activation was further decreased in DM mice suffering from tGCI/R injury, leading to adverse effects on neurogenesis and cognitive function.
Figure 3|Generation of iMSCs and characterization of iMSC-sEVs.

iPSCs were grown clonally (Figure 3A) and shown to be positive for alkaline phosphatase (Figure 3B) and pluripotency-related markers, including OCT4, Nanog, TRA-1-81, and SSEA4 (Figure 3C). After induction in MSC-induction medium, iPSCs lost their typical morphology and formed a monolayer of larger spindle-shaped cells at the border of the colonies (Figure 3D-a). After trypsinization and passaging three times, the cells developed a uniform fibroblast-like morphology (Figure 3D-b). iMSCs possessed powerful adipogenic (Figure 3E) and osteogenic differentiation capabilities (Figure 3F) and were positive for MSC-positive markers including CD29, CD90, and CD105, and negative for MSC-negative markers, such as HLA-DR (Figure 3G). These results indicated that the iPSCs were successfully differentiated into MSCs.
iMSC-sEVs isolated from iMSC-CM by differential ultracentrifugation exhibited a size distribution of approximately 100 nm, with a characteristic cup-shaped morphology under transmission electron microscopy (Figure 3H). Western blot analysis showed that iMSC-sEVs also expressed the exosomal markers CD63 and TSG101, but not express the Golgi matrix protein GM130 and β-actin (Figure 3I), indicating no contamination of the isolated iMSC-sEVs by cellular components (Hu et al., 2020). Flow cytometry analysis identified particles with a mean diameter of 73.9 ± 26.3 nm and a concentration of 8.1 × 10¹⁰ ± 0.6 × 10¹⁰ particles/mL (Figure 3J). We further calculated the particle concentration and protein concentration by evaluating the yield of iMSC-sEVs. The mean particle concentration was 5.62 × 10⁸ ± 1.17 × 10⁸ particles/mL iMSC-CM and 547.4 ± 64.6 particles/cell (Figure 3K). The mean protein concentration was 731.9 ± 86.2 ng/mL iMSC-CM and 9.6 × 10⁻⁷ ± 1.8 × 10⁻⁷ ng/particle.
Figure 5|iMSC-sEVs promote H-NSC proliferation and neurogenesis in the SGZ in DM-tGCI/R mice.

We also detected the numbers of H-NSCs (Sox2+/GFAP+) and newly generated immature neurons (DCX+) and their proliferation statuses (EdU+) in the SGZ. The application of iMSC-sEVs (DM-sham + sEVs and DM-tGCI/R + sEVs groups) significantly increased the number of Sox2+/GFAP+ and Sox2+/ EdU+ cells in the SGZ compared with vehicle-treated mice in the DM-sham (DM-sham + PBS group) and DM-tGCI/R groups (DM-tGCI/R + PBS group), (Sox2+/GFAP+: P = 0.0002 for DM-tGCI/R + sEVs vs. DM-tGCI/R + PBS; Sox2+/ EdU+: P = 0.0015 for DM-tGCI/R + sEVs vs. DM-tGCI/R + PBS; Figure 5A–D). Although the numbers of Sox2+/GFAP+ and Sox2+/EdU+ cells in the SGZ were lower in DM-tGCI/R + sEVs compared with DM-sham + sEVs mice, the numbers were similar to those in DM-sham + PBS mice. In addition, the numbers of total DCX+ and DCX+/EdU+ cells were higher in DM-sham + sEVs and DM-tGCI/R + sEVs mice compared with DM-sham + PBS and DM-tGCI/R + PBS mice (DCX+: P = 0.0004 for DM-tGCI/R + sEVs vs. DM-tGCI/R + PBS; DCX+/EdU+: P = 0.0002 for DM-tGCI/R + sEVs vs. DM-tGCI/R + PBS; Figure 5E–G). Proliferation and neuronal-differentiation assays showed that the percentages of proliferating H-NSCs (EdU+/DAPI+ cells) and differentiated neurons (β-III tubulin+ cells) were significantly higher in the DM-sham + sEVs and DM-tGCI/R + sEVs groups compared with the DM-sham + PBS and DM-tGCI/R + PBS groups (EdU+/DAPI+: P = 0.0001 for DM-tGCI/R + sEVs vs. DM-tGCI/R + PBS; β-III tubulin+: P = 0.0001 for DM-tGCI/R + sEVs vs. DM-tGCI/R + PBS; Figure 5H–K). These results indicated that iMSC-sEVs possessed a powerful ability to promote H-NSC proliferation and neurogenesis in DM mice suffering from tGCI/R injury, resulting in cognitive recovery.
Figure 6|iMSC-sEVs promote H-NSC neurogenesis in vitro.
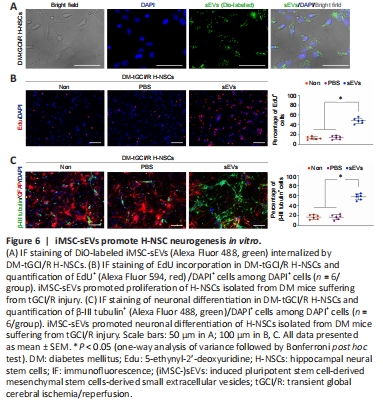
We further investigated the mechanism by which iMSC-sEVs promoted H-NSC proliferation and neuronal differentiation. Internalization assay showed that, after incubation for 12 hours, DiO-labeled iMSC-sEVs were internalized by H-NSCs isolated from DM-tGCI/R mice (Figure 6A). We then detected the proliferation and neuronal differentiation-promoting functions of H-NSCs isolated from DM-tGCI/R mice in vitro. The percentages of proliferating H-NSCs and differentiated neurons were significantly higher in the iMSC-sEVs group compared with the PBS and non-treatment (Non) groups (EdU+/DAPI+: P = 0.0001 for sEVs vs. PBS, P = 0.0006 for sEVs vs. Non; β-III tubulin+: P = 0.0001 for sEVs vs. PBS, P = 0.0001 for sEVs vs. Non; Figure 6B and C). These results further demonstrated that iMSC-sEVs promoted hippocampal neurogenesis in mice suffering from tGCI/R injury.
Figure 8|iMSC-sEVs transfer miR-21-5P and miR-486-5P to promote H-NSC proliferation and neuronal differentiation.
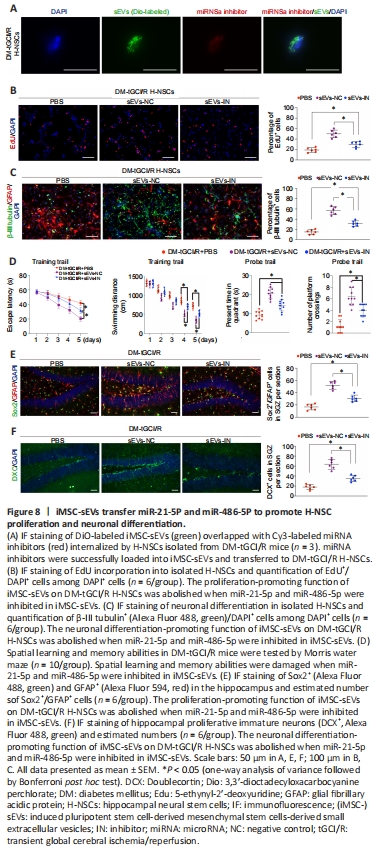
We tested this hypothesis by transferring inhibitors of miR-21-5p and miR-486-5p into iMSC-sEVs to block their function. DiO-labeled iMSC-sEVs overlapped with Cy3-labeled miRNA inhibitors in cells, suggesting that the miRNA inhibitors were successfully loaded into iMSC-sEVs and transferred to DM-tGCI/R H-NSCs (Figure 8A). The proliferation- and neuronal differentiation-promoting functions of iMSC-sEVs in DM-tGCI/R H-NSCs were abolished after incubation with miRNA inhibitor-containing iMSC-sEVs (sEVs-IN group) compared with iMSC-sEVs without miRNA inhibitors (sEVs-NC group), although the percentages of proliferating H-NSCs and differentiated neurons were higher than in the PBS group (EdU+/DAPI+: P = 0.0001 for NC vs. IN, P = 0.0039 for IN vs. PBS; β-III tubulin+: P = 0.0001 for NC vs. IN, P = 0.0007 for IN vs. PBS; Figure 8B and C). We also injected iMSC-sEVs containing miRNA inhibitors intravenously into DM-tGCI/R mice. The escape latency and swimming distance for mice in the sEVs-IN group were longer than in sEVs-NC mice, but shorter than in mice in the PBS group (escape latency: P = 0.0038 for NC vs. IN, P = 0.0001 for IN vs. PBS; swimming distance: P = 0.0003 for NC vs. IN, P = 0.0001 for IN vs. PBS; Figure 8D). The time spent in the target quadrant for mice in the sEVs-IN group was shorter than that in the sEVs-NC group, but longer than that in the PBS group (P = 0.0007 for NC vs. IN, P = 0.0003 for IN vs. PBS). Mice in the sEVs-IN group had fewer platform crossings compared with the sEVs-NC group, but more than in the PBS group (P = 0.0019 for NC vs. IN, P = 0.0015 for IN vs. PBS). Moreover, the numbers of Sox2+/GFAP+ cells and DCX+ cells in the SGZ in sEVs-IN mice were lower than in sEVs-NC mice but higher than in the PBS group (Sox2+/GFAP+: P = 0.0006 for NC vs. IN, P = 0.0002 for IN vs. PBS; DCX+: P = 0.0001 for NC vs. IN, P = 0.0001 for IN vs. PBS). These results thus indicated that iMSC-sEVs promoted DM-tGCI/R H-NSC self-renewal and neurogenesis, resulting in cognitive recovery in DM-tGCI/R mice, partly via the transfer of miR-21-5p and miR-486-5p.
点击此处查看全文