视神经损伤
-
Figure 1|Flow chart of study design.
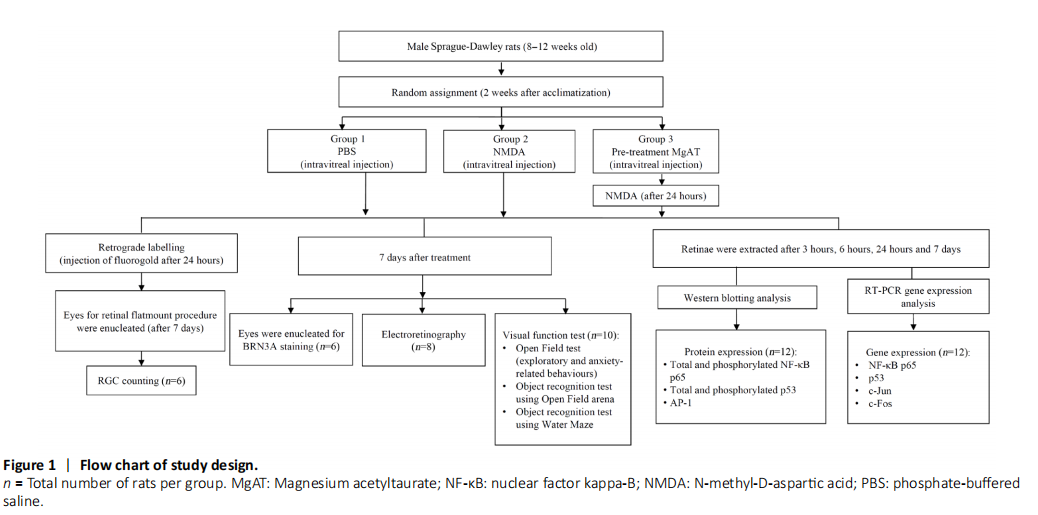
Intraperitoneal injection of the mixture of ketamine (Ilium Ketamil, 100 mg/mL, #51188, Troy Laboratories, Glendenning, New South Wales, Australia) and xylazine (Xylazil-100, 100 mg/mL, #3828, Troy Laboratories) (0.1 mL/100 g of body weight) was given to induce maximum sedation and immobility. Powdered NMDA (#M3262-1G, Sigma-Aldrich, St. Louis, MO, USA) and MgAT were dissolved in 0.1 M of phosphate buffered saline (PBS, #P5244, Sigma-Aldrich) at 160 and 320 nmol, respectively. Alcaine 0.5% (#NDC0998001615, proparacaine hydrochloride ophthalmic solution, Alcon Laboratories, Geneva, Switzerland) was topically applied before the procedure. A 30-gauge needle (#7803-07, Hamilton Company, Reno, NV, USA) mounted on a 10-μL Hamilton syringe (#7635-01, Hamilton Company) was used to administer the intravitreal injections. All intravitreal injections were done in a total volume of 2 μL (Figure 1).
Figure 2|Schematics describing the procedure of retinal flatmount preparation.
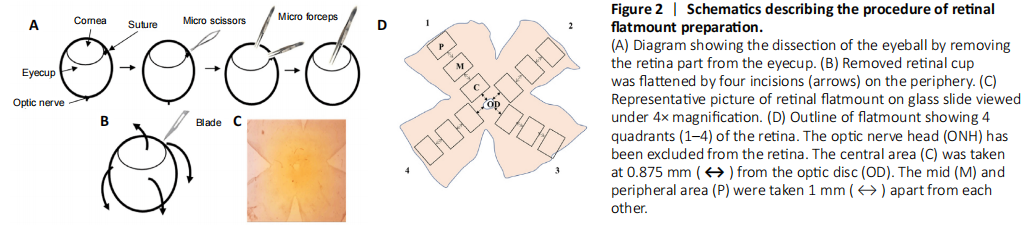
Goeschwitzer Strasse, Jena, Germany). The retinal flatmounts were prepared by giving four incisions from the periphery of the retina (Figure 2). To observe the FG-labelled RGCs, a fluorescence microscope was used with a 515 nm rhodamine fluorescence filter (#IX81, Olympus IX81 microscope, Olympus America, Center Valley, PA, USA). From each of the four retinal quadrants, the images were captured from three areas (central, mid and peripheral field of retina) with 400× magnification (Figure 2D). For counting the FG-labelled RGCs, the image analysis software, ImageJ version 1.53g (National Institutes of Health, Bethesda, MA, USA) was used. The RGC counting was performed by three blinded investigators in 12 images representing 12 areas, three in each quadrant of each retina. The counts of FG-labelled RGCs in each image were then converted into RGC density per square millimetre (cells/mm2). The RGC densities of all 12 images were averaged for each retina as described earlier and the average values for all six retinae per group were used for statistical analysis (Schlamp et al., 2013; Nor Arfuzir et al., 2020).
Figure 3|Representative fluorescent micrograph of retinal flatmount after superior colliculus injection with fluorogold.
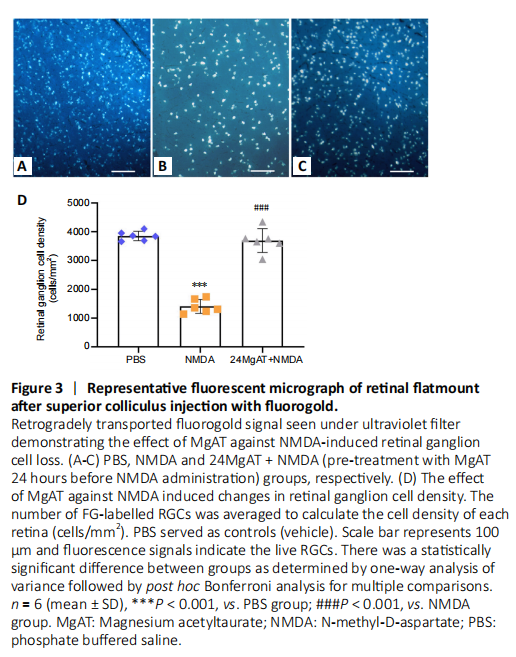
The number of FG-labelled RGCs signals was the lowest in NMDA exposed retinas, with a significantly lower RGC density by 10.5 folds (365.85 ± 216.91 cells/mm2, P < 0.01) when compared to PBS group (3832.21 ± 200.40 cells/mm2). Pre-treatment with MgAT preserved the number of RGCs and in this group RGC density was significantly higher when compared to NMDA group (3663.46 ± 652.91 cells/mm2, P < 0.01). The RGC density was comparable between PBS and 24MgAT + NMDA groups with no significant differences (P = 1.00; Figure 3).
Figure 4|Representative light micrographs of BRN3A immunostained retinal sections showing the effect of MgAT against NMDA-induced RGC loss.
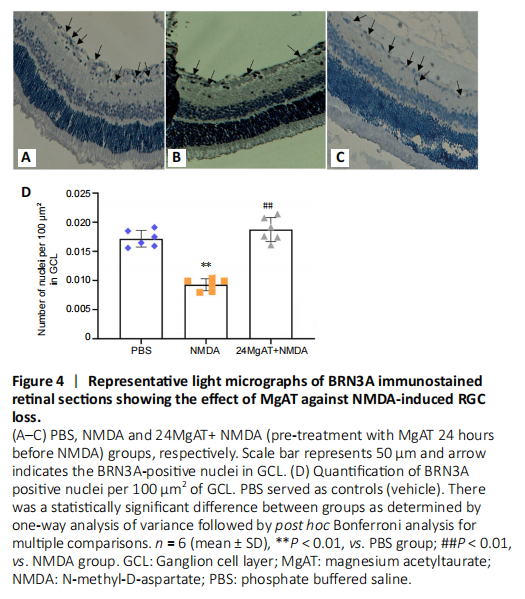
After the intravitreal administration of NMDA, 1.85 fold lesser BRN3A-positive nuclei were observed in GCL compared with the PBS group (0.009 ± 0.001 vs. 0.017 ± 0.001, P < 0.01). The 24MgAT + NMDA group (0.018 ± 0.002) showed 2-fold higher number of BRN3A-positive cells compared to the NMDA group (P < 0.01). However, the number of BRN3A-positive cells in both the PBS and 24MgAT + NMDA groups was comparable with no significant differences (P = 0.312; Figure 4).
Figure 5|Effect of MgAT on NMDA-induced changes in a- and b- wave amplitudes (μV) in ERG.
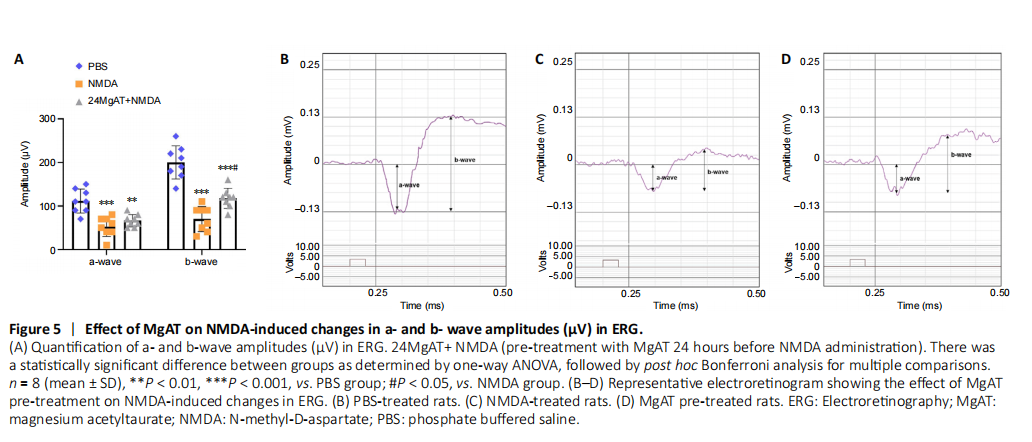
A representative of ERG of rat in the control group is shown in Figure 5B. After exposure to NMDA, the amplitudes of a-wave (52.50 ± 22.52, P < 0.01) and b-wave (70.00 ± 28.78, P < 0.01) were clearly lower than the same amplitudes in PBS-treated rats (P < 0.01) (Figure 5C). While the amplitude of a-wave and b-wave remained significantly lower compared with the PBS group (P = 0.002 and P < 0.01, respectively) (Figure 5A and Table 2), pre-treatment with MgAT caused significantly (Figure 5D) greater b-wave amplitude compared with the NMDA group and the difference amounted to 67.9% (117.50 ± 23.14, P = 0.016).
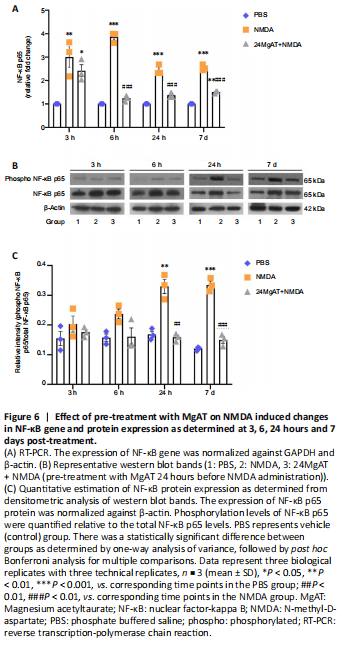
Figure 6|Effect of pre-treatment with MgAT on NMDA induced changes in NF-κB gene and protein expression as determined at 3, 6, 24 hours and 7 days post-treatment.
Effect of MgAT on NMDA-induced changes in the retinal
NF-κB p65 gene expression
NF-κB p65 is one of the transcription factors that promote apoptotic cell death in response to glutamate excitotoxicity by stimulating proapoptotic signaling cascades (Iomdina et al., 2007). Therefore, in this study, NF-κB p65 gene and protein expressions were measured at four time points (3, 6 and 24 hours and 7 days post-treatment). The time course analysis revealed an increased NF-κB gene expression in NMDA-injected retinas that peaked after 6 hours of NMDA exposure. As shown in Figure 6A, the NMDA group showed significant upregulation of NF-κB gene expression after 3, 6, 24 hours and 7 days after intravitreal administration by 3 (3 ± 0.75, P = 0.009), 3.9 (3.87 ± 0.23, P < 0.01), 2.4 (2.45 ± 0.21, P < 0.01) and 2.5 (2.55 ± 0.13, P < 0.01) folds, respectively, compared to the PBS group. In contrast, NF-κB gene expression in the 24MgAT + NMDA group was downregulated after 6 hours and was sustained on that level until day 7. NF-κB gene expression in the 24MgAT + NMDA group was 1.2 (1.24 ± 0.12, P < 0.01), 1.4 (1.37 ± 0.11, P < 0.01) and 1.4 (1.42 ± 0.12, P < 0.01) folds lower at 6, 24 hours and 7 days after treatment, compared to the NMDA group.
Effect of MgAT on NMDA-induced changes in retinal NF-κB p65 protein expression: Western blot assay
In this study, the expression of NF-κB p65 protein was estimated using western blot assay (Figure 6B). Densitometric analysis is presented in Figure 6C. The NF-κB protein expression in NMDA exposed retinas was found to be significantly higher after 24 hours by 1.9 (0.33 ± 0.04, P = 0.001) folds and after 7 days by 2.8 (0.33 ± 0.02, P < 0.01) folds compared to the PBS group. Pre-treatment with MgAT suppressed NMDA-induced NF-κB upregulation in the retina by 2 (0.16 ± 0.01, P = 0.01) folds at 24 hours and by 2.2 (0.15 ± 0.02, P < 0.01) folds after 7 days. In MgAT-treated retinae, NF-κB protein expression was comparable to the PBS group at all time points post-treatment.
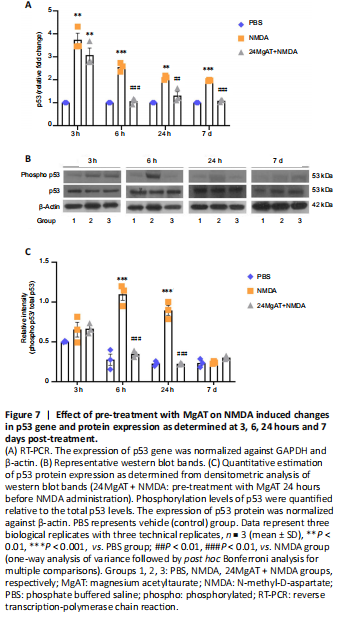
Figure 7| Effect of pre-treatment with MgAT on NMDA induced changes in p53 gene and protein expression as determined at 3, 6, 24 hours and 7 days post-treatment.
Effect of MgAT on NMDA-induced changes in p53 gene expression in retina: RT-PCR
p53 gene and protein expression were evaluated at four time points (3, 6 and 24 hours and 7 days). The time course analysis for the NMDA group showed increased gene expression of p53 at all time points compared to the PBS group. The highest level of p53 gene expression was seen at 3 hours after intravitreal NMDA injection amounting to a 3.7 fold difference from the PBS group (3.75 ± 0.5, P = 0.001). The p53 gene expression in the NMDA group gradually declined over the next 24 hours. However, it remained significantly higher compared to the PBS group after 6, 24 hours and 7 days by 2.5 (2.56 ± 0.1, P < 0.01), 2 (2.0 ± 0.9, P = 0.001) and 2 (1.97 ± 0.2, P < 0.01) folds, respectively. In MgAT pre-treated group, p53 gene expression initially peaked at 3 hours with a 3 fold difference from the PBS group (3.0 ± 0.5, P = 0.003). However, it declined after 6 hours and became comparable to the PBS group subsequently. In fact, at 6, 24 hours and 7 days post-treatment, p53 gene expression in the 24MgAT + NMDA group was lower by 2.5 (1.0 ± 0.13, P < 0.01), 1.6 (1.3 ± 0.2, P = 0.004), and 1.8 (1.0 ± 0.05, P < 0.01) folds compared to the NMDA group (Figure 7A).
Effect of MgAT on NMDA-induced changes in p53 protein expression: Western blot assay
p53 protein expression was significantly upregulated by 3.7 (1.1 ± 0.1, P < 0.01) and 4 (0.9 ± 0.1, P < 0.01) folds after 6 and 24 hours respectively in the NMDA group compared to the PBS group. Pre-treatment with MgAT suppressed NMDA-induced p53 upregulation in the retina by 3.2 (0.35 ± 0.04, P < 0.01) and 4 (0.22 ± 0.01, P < 0.01) folds after 6 and 24 hours, respectively, as compared with the NMDA group. The expression of p53 in the 24MgAT + NMDA group was comparable to that in the PBS group at 6 hours post-treatment and its expression persisted at that level subsequently (Figure 7B and C).
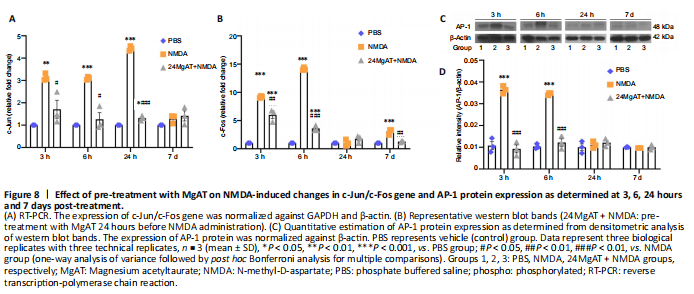
Figure 8| Effect of pre-treatment with MgAT on NMDA-induced changes in c-Jun/c-Fos gene and AP-1 protein expression as determined at 3, 6, 24 hours and 7 days post-treatment.
Effect of MgAT on NMDA-induced changes in c-Jun gene expression in the retina: RT-PCR
c-Jun gene expression leads to the formation of AP-1 transcription factor which is involved in the transcription of pro apoptotic genes. In this study, c-Jun gene expression in the NMDA group was upregulated at 3, 6 and 24 hours with the peak effect seen at 24 hours after injection as compared with the PBS group with a difference of 3.1 (3.13 ± 0.16, P = 0.002), 3.1 (3.1 ± 0.06, P < 0.01), and 4.4 (4.4 ± 0.1, P < 0.01) folds, respectively. Expression of c-Jun was significantly downregulated in the 24MgAT + NMDA group at 3, 6 and 24 hours by 1.8 (1.7 ± 0.7, P = 0.016), 2.4 (1.2 ± 0.5, P = 0.001), and 3.3 (1.3 ± 0.1, P < 0.01) folds as compared with the NMDA group. The gene expression in both the NMDA and 24MgAT + NMDA groups was comparable to that in the PBS group after 7 days of intravitreal administration (Figure 8A).
Effect of MgAT on NMDA-induced changes in c-Fos gene expression in the retina
c-Fos is one of the immediate early genes which binds to the AP-1 complex to promote cell death. The gene expression of c-Fos in NMDA exposed retinae was upregulated after 3 hours of intravitreal administration and was significantly higher by 9 (9.2 ± 0.1, P < 0.01) folds compared with the control group. Subsequently, the expression of c-Fos peaked at 6 hours post NMDA injection and drastically reduced after 24 hours of injection. At 3 hours after treatment, c-Fos expression in the 24MgAT + NMDA group displayed a 6-fold (5.9 ± 1.0, P < 0.01) upregulation compared the PBS group. The c-Fos gene expression in the 24MgAT + NMDA group was lower by 1.5 (P = 0.003), 3.9 (3.6 ± 0.5, P < 0.01) and 2.4 (1.27 ± 0.1, P = 0.001) folds at 3, 6 hours and 7 days, respectively (Figure 8B) compared with the NMDA group.
Effect of MgAT on NMDA-induced changes in AP-1 protein expression in the retina
AP-1 is a ubiquitous protein complex that can be activated by the NMDA-induced excitotoxicity and leads to the activation of Jun and Fos family members. Figure 8C and D shows that in NMDA exposed retinae, AP-1 protein expression was upregulated at 3 and 6 hours after the intravitreal administration compared with the PBS group at the corresponding time points. At these time points, the NMDA group showed greater AP-1 expression than did the PBS group by 3.6 (P < 0.01) and 3.2 (P < 0.01) folds, respectively. The 24MgAT + NMDA group showed significantly lower AP-1 expression at 3 and 6 hours post injection by 3.9 (P < 0.01) and 3.3 (P < 0.01) folds when compared with the NMDA group. The AP-1 protein expression in all three groups was comparable after 24 hours of intravitreal treatment.
Figure 9| The effect of MgAT against NMDA-induced changes in exploratory and locomotor activity of rats using the Open Field Test.
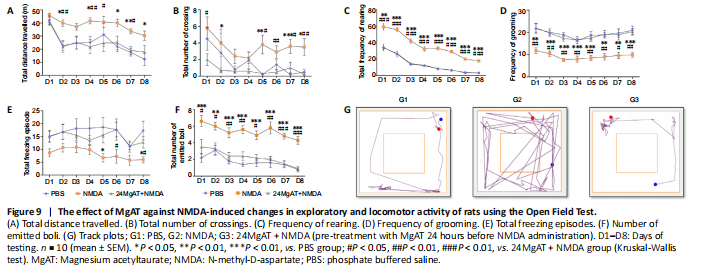
The open field test was done to measure the exploratory and locomotor activity of rats. The animals were first habituated to the open field arena. As shown in each of the behavioral activity in Figure 9, the behavioral patterns of NMDA-treated rats as measured by total distance travelled, number of line crossing, rearing, number of freezing and grooming episodes and faecal boli count, indicated significantly higher exploratory activity compared with PBS and MgAT-treated rats.
Figure 10| The effect of MgAT against NMDA-induced changes in visual function using an open field arena.

During ORT (Figure 10A) at the familiarization phase (Trial 1), the number of approaches to novel objects was similar among rats in all tested groups. At the object displacement phase (Trial 2) (Figure 10B), when objects 4 ( ) and 5 ( ) were relocated to a novel location, the numbers of approaches to the non-displaced objects 1 ( ), 2 ( ) and 3 ( ) in the 24MgAT + NMDA group were significantly lower by 2.4 (6 ± 1.08, P = 0.001), 1.6 (11.6 ± 1.68, P = 0.023), and 1.7 (11.25 ± 0.7, P = 0.000) folds, respectively, and in the control group by 2.15 (6.9 ± 0.5, P = 0.002), 1.5 (12.4 ± 0.9, P = 0.039), and 1.3 (14.25 ± 2.16, P = 0.013) folds, respectively, compared with the NMDA group. In the next trial for object replacement (Trial 3) (Figure 10C), when object 1 ( ) was replaced by object 1A ( ), the number of approaches to the non-replaced objects 2 ( ), 3 ( ), 4 ( ) and 5 ( ) was lower in the PBS group by 2.3 (6.6 ± 1.9, P = 0.006), 2.2 (7.14 ± 0.1, P = 0.005), 2 (7.8 ± 1.5, P = 0.014) and 3.4 (4 ± 1.44, P = 0.000) folds, respectively, and in the 24MgAT + NMDA group by 2.98 (9.1 ± 1.2, P = 0.003), 3.2 (9.23 ± 1.23, P < 0.01), and 4 (9.36 ± 1.15, P < 0.01) and 1.8 (8.5 ± 0.82, P = 0.029) folds, respectively, compared with the NMDA group. The number of approaches to the replaced object 1A ( ) was higher than that to non-replaced objects 2 ( ), 3 ( ), 4 ( ) and 5 ( ) in the MgAT and PBS groups. However, no difference was observed in the number of approaches to replaced objects versus non-replaced objects in the NMDA group.
Figure 11| The effect of intravitreal administration of MgAT against NMDA-induced changes in visual recognition using a water maze.
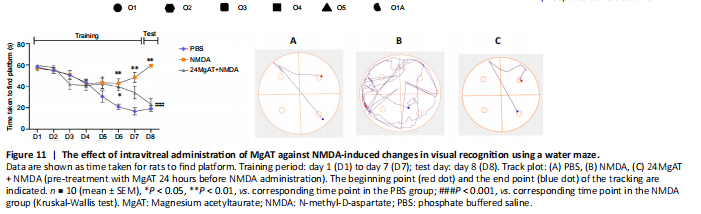
A modified Morris water maze was also used for the ORT. In this test, we recorded how much time the rats took to find the platform. No significant differences were observed among the three groups from day 1 to day 5. However, from day 6 to day 7, task performance was significantly lower in the NMDA and 24MgAT + NMDA groups than that in the PBS group. On testing day 8, the NMDA group showed a significantly lower (3.1 fold) task performance (59.35 ± 0.4, P = 0.000) than the PBS group (19.0 ± 2.6). Meanwhile, the task performance in the 24MgAT + NMDA group was comparable to that in the control group (Figure 11), but it showed a significantly higher task performance of 2.6 (23.14 ± 5.2, P = 0.001) folds compared with the NMDA group.
Figure 12|Schematic representation of effect and antiapoptotic mechanism of neuroprotection by MgAT against NMDA-induced retinal damage.
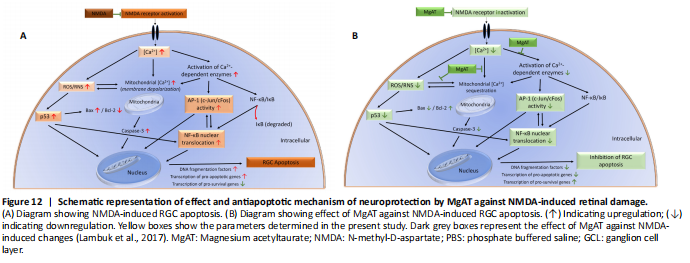
It is noteworthy that observations made in this study may have resulted from a cross-talk among NF-κB, p53 and AP-1. Since, p53 activation has been shown to occur downstream of NF-κB activation (Aleyasin et al., 2004), it is likely that the effect of MgAT pre-treatment on the expression of p53 is secondary to its effects on NF-κB expression. Similar studies have shown cross talk between AP-1 and NF-κB. Accordingly, in TNF-α-treated mammalian retina, induction of AP-1 was shown to activate IKK complex, which in turn activated NF-κB (Zhao and Lee, 1999; Yang et al., 2001). Therefore, it is also likely that the effects of MgAT pre-treatment on NF-κB expression are secondary to its effects on AP-1 expression. In Figure 12, we propose the possible mechanisms underlying the neuroprotective effects of MgAT against NMDA-induced RGC loss based on the results of the current study as well as earlier findings.