周围神经损伤
-
Figure 1|Observation of the surgical zone in rats given sciatic nerve transposition repair.
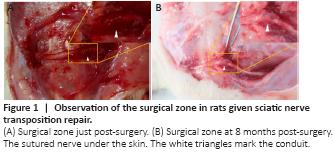
Figure 2|Observation of the hind limbs in rats with sciatic nerve transposition repair.
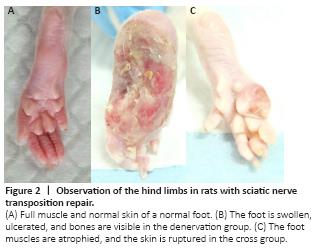
At 8 months post-surgery, the nerve suture area was covered with connective tissue with no neuroma or neuroedema. The conduits were partially absorbed. In the denervation group, the foot ulcer was found to be swollen, and normal foot anatomy could not be distinguished. The cross group showed obvious signs of atrophy and some autophagy (Figures 1 and 2).
Figure 3|Morphology of myelinated nerve fiber sheaths in rats with sciatic nerve transposition repair at 8 months post-surgery (osmium acid staining).

Osmium acid staining showed that compared with the control group, the myelin sheath of myelinated nerve fibers in the cross group was thinner, sparsely distributed, and lighter in color. The nerves in the cross group were regenerated to an extent, and many myelinated nerve fibers were visible (Figure 3).
Figure 4|Morphology of muscle fibers in the central part of the anterior tibialis of rats given sciatic nerve transposition repair at 8 months post-surgery (hematoxylin-eosin staining).

The muscle fibers in the control group were tightly arranged, with sharp edges and corners, and no pathological features were observed. The gaps between the muscle fibers in the cross group were increased and the diameter of the muscle fibers was smaller compared with the control group. Circular muscle fibers were seen, with less infiltration of connective tissue. In the denervation group, muscle fibers were filled with fat and connective tissue, and they showed signs of obvious atrophy (Figure 4).
Figure 5|Resting-state fALFF maps of the whole brain compared between sciatic nerve transposition repair and normal rats at 8 months post-surgery.

The fALFF values of eight brain regions in the left hemisphere and 13 brain regions in the right hemisphere were significantly higher in the surgery group compared with the control group (P < 0.005; Table 2 and Figure 5). The fALFF values of 10 brain regions in the left hemisphere and 6 brain regions in the right hemisphere were lower in the surgery group compared with the control group (P < 0.005; Table 2 and Figure 5).
Figure 6|Resting-state ReHo maps of the whole brain compared between sciatic nerve transposition repair and normal rats at 8 months post-surgery.

The ReHo values of eight brain regions in the left hemisphere and 11 brain regions in the right hemisphere were significantly higher in the surgery group compared with the control group (P < 0.005; Table 3 and Figure 6). The ReHo values of 16 brain regions in the left hemisphere and 19 brain regions in the right hemisphere were lower in the surgery group compared with the control group (P < 0.005; Table 3 and Figure 6).
Figure 7|Global metric differences in different brain regions in rats with sciatic nerve transposition repair at 8 months post-surgery.
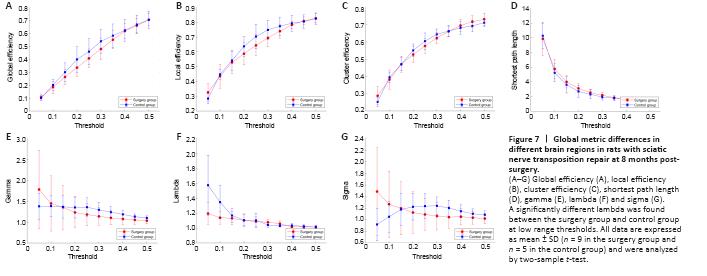
A significantly different normalized characteristic path length (lambda) was found between the surgery and control groups at low range thresholds (P < 0.05). There was no significant difference in other indicators (Figure 7).
Figure 8|Local metric differences in different brain regions in rats with sciatic nerve transposition repair.
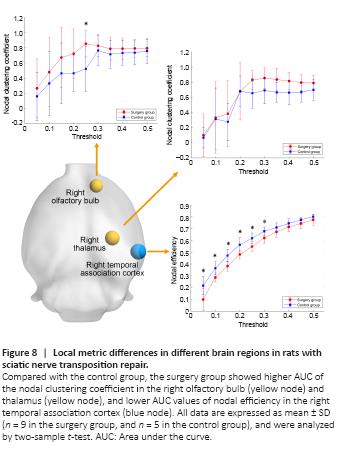
The right olfactory bulb, right thalamus and right temporal association areas showed significant differences between the control and surgery groups (P < 0.05). However, only the right temporal association cortex showed significant differences at a low threshold (P < 0.05; Figure 8).
Figure 9|Overall topological properties of the brain in rats with sciatic nerve transposition repair.
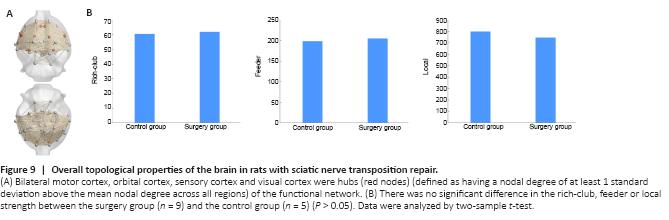
There was no difference in rich-club, feeder or local strength between the control and surgery groups (P > 0.05; Figure 9).