神经退行性病
-
Figure 1|Assembling of NTS-polyplex nanoparticles encompassing the plasmid pNBRE3×-hCDNF.
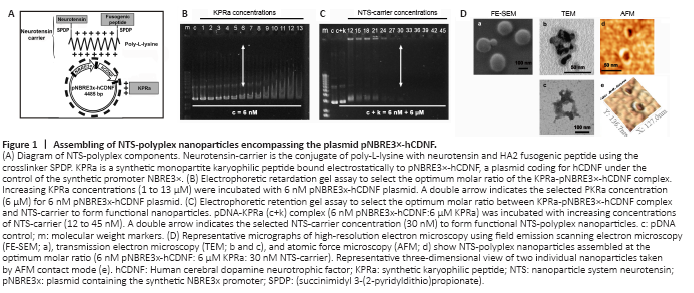
The NTS-polyplex nanoparticles were electrostatically assembled by binding the cationic NTS-carrier with the anionic KPRa-pNBRE3×-hCDNF complex (Figure 1A) in two steps using Dulbecco′s modified Eagle′s medium (DMEM; Thermo Scientific, Rockford, IL, USA) as a vehicle (Navarro-Quiroga et al., 2002; Hernandez-Baltazar et al., 2012).
First step. The KPRa-pNBRE3×-hCDNF complex is formed by incubating increasing concentrations (1–13 μM) of cationic KPRa (KMAPKKRK; > 90% purity; Peptide 2.0; Chantilly, VA, USA) to an invariable 6 nM pNBRE3×-hCDNF (anionic). After 30-minute incubation, an electrophoretic retardation assay was performed by subjecting the samples at 80 V for 30 minutes in a 0.8% agarose gel using 40 mM Tris-Acetate, 1 mM EDTA buffer, pH8 (TAE). The gel was stained with ethidium bromide (10 μg/mL) to select the KPRa concentration (6 μM) that delays pNBRE3×-hCDNF band migration up to half of the control band (Figure 1B), based on the criterion previously established (Navarro-Quiroga et al., 2002; Hernandez-Baltazar et al., 2012). A recent report shows that at that molar ratio (6 μM KPRa:6 nM pDNA), the KPRa-pDNA complex leaves free negative charges to allow binding of the NTS-carrier in the following step (Lopez-Salas et al., 2020).
Second step. The NTS-polyplex nanoparticles are formed by incubating the KPRa-pNBRE3×-hCDNF complex (6 μM KPRa: 6 nM pNBRE3×-hCDNF) with increasing concentrations (1–45 nM) of NTS-carrier. After 30 min incubation, the samples were subjected to electrophoretic retention gel assay using the conditions described above. According to the criterion previously established (Navarro-Quiroga et al., 2002; Arango-Rodriguez et al., 2006; Hernandez-Baltazar et al., 2012; Martinez-Fong et al., 2012), the optimum molar ratio was obtained at 30 nM NTS-carrier concentration, which follows the concentration producing the last visible retention of the KPRa-pNBRE3×-hCDNF band. The selected NTS-concentration produces the complete neutralization of the KPRa-pDNA complex charges (Lopez-Salas et al., 2020). The optimum molar ratio to assemble functional NTS-nanoparticles was 6 nM pNBRE3×-hCDNF:6 μM KPRa:30 nM NTS-carrier (Figure 1C), the total amount of pNBRE3×-hCDNF injected into the substantia nigra pars compacta (SNc) was 260 ng (based on plasmid weight).
Figure 2|Production and release of hCDNF in N1E115-Nurr1 cells.

N1E115-Nurr1 cells were transfected with NTS-polyplex nanoparticles containing the plasmid pNBRE3×-hCDNF to test hCDNF expression driven by NBRE3× promoter. Transfection with lipofectamine was a control. ELISA measurements showed no hCDNF levels in untransfected cells (Figure 2A). In contrast, pNBRE3×-hCDNF transfection by NTS-polyplex nanoparticles or lipofectamine generated hCDNF in N1E115-Nurr1 cells (Figure 2A). hCDNF levels in the culture medium elicited by lipofectamine were higher than those by NTS-polyplex nanoparticle transfection (Figure 2A). However, the opposite trend was observed in cell extracts (Figure 2A). CDNF is a primarily ER lumen-located protein for bearing a KDEL-like ER retention sequence that can be secreted under cellular stress to protect neighboring cells in a paracrine fashion as MANF (Huttunen and Saarma, 2019) by a possible mechanism depending on cell surface KDEL receptors (Henderson et al., 2013). Lipofectamine-induced cellular stress (Fiszer-Kierzkowska et al., 2011) could potentially explain the higher secretion of hCDNF compared with NTS-polyplex nanoparticles. While lipofectamine is highly efficient for in vitro transfections, it exerts a degree of cytotoxicity on cultured cells (Rahimi et al., 2018; Wang et al., 2018), especially in cotransfections as was used here (Wang et al., 2018). In contrast, NTS-polyplex nanoparticle transfection in vitro is limited by NTSR1 endocytosis (Espadas-Alvarez et al., 2017) but is safe in the concentration range used (Arango-Rodriguez et al., 2006).
The immunofluorescence assays also showed the absence of hCDNF immunoreactivity in untransfected cells and its presence in both cells transfected with lipofectamine or NTS-polyplex nanoparticles (Figure 2B). Altogether, these results show that the p3×NBRE-hCDNF plasmid is functional, enabling the expression of secreted hCDNF.
Figure 3|Dopamine neuron recovery from the 6-OHDA lesion follows the increase in CDNF levels in the SNc.
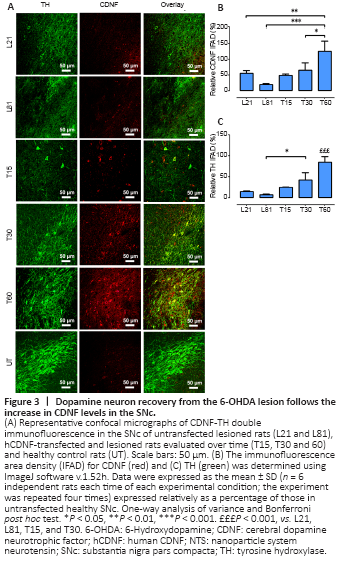
In agreement with previous reports (Nadella et al., 2014), double immunofluorescence assays against TH and CDNF revealed that CDNF was absent in TH+ cells but present in TH– cells (Figure 3A and B) in both healthy and 6-OHDA lesioned SNc. However, 15 days after hCDNF gene transfection, CDNF immunoreactivity appeared in TH+ cells of the SNc with 21 days of 6-OHDA lesion, and its levels significantly increased from 30 to 60 days post-transfection, reaching the levels of healthy controls (Figure 3A and B). As expected, 6-OHDA caused an 84.4 ± 1.1% significant decrease in TH immunoreactivity on day 21 that remained until day 60 post-lesion (Figure 3A and C). Interestingly, the progressive recovery of TH immunoreactivity in the transfected group (Figure 3A and C) followed the time course of hCDNF levels (Figure 3A and B). This association suggests that hCDNF may promote the recovery of dopaminergic neurons, which are the source of hCDNF, as confirmed by the confocal orthogonal view (Additional Figure 2). ELISA measurements using a specific antibody did not detect hCDNF in the SNc of healthy rats and untransfected rats at 21 or 81 days of the lesion. In contrast, hCDNF levels were present in the SNc since days 15 to 60 post-transfection without a statistically significant difference (Table 1). ELISA measurements in the striatum also yielded similar results (Table 1), suggesting that hCDNF traveled from the SNc to the striatum via anterograde axonal transport.
Figure 4|hCDNF gene transfection increases TH+ neuron population and branching density in the SNc of rats with 6-OHDA lesion.

n the SNc, 6-OHDA decreased TH+ cell population by 88.7 ± 2.8% and branching density by 84.6 ± 9.9% (Figure 4A–C) compared with the UT group. Such a decrease remained unaltered until the end of the study, thus showing the absence of spontaneous recovery (Figure 4A and B). In contrast, hCDNF gene transfection caused a significant increase in both the number (reaching 63.1 ± 11.2%) and branching (75.9 ± 16.1%) of TH+ cells as compared with untransfected lesioned rats (Figure 4).
Figure 5|hCDNF gene transfection increases TH+ density area in the striatum of rats with 6-OHDA lesion.
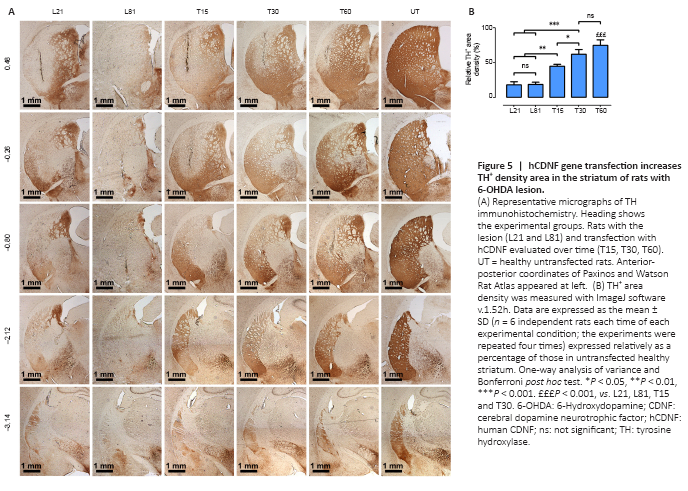
In the striatum, 6-OHDA decreased TH+ fiber density by 81.6 ± 4.7% compared with the UT group, and the recovery was 75.1 ± 7.6% after the intranigral hCDNF gene transfection compared with the untransfected lesioned rats (Figure 5).
Figure 6|hCDNF gene transfection recovers neuron cytoskeleton in TH+ cells of rats with 6-OHDA lesion.
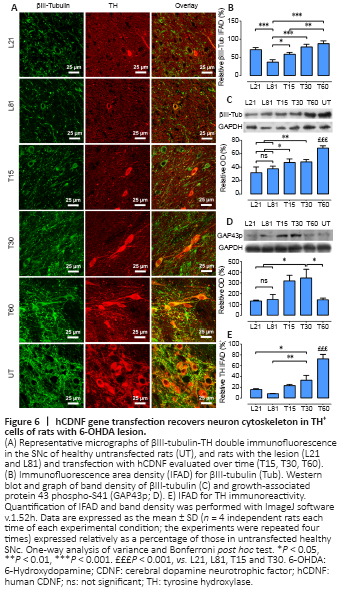
The 6-OHDA lesion also significantly decreased the immunoreactivity of βIII-tubulin, a neuronal cytoskeleton protein (Katsetos et al., 2003), in the SNc on days 21 (30%) and 60 (70%) post-lesion compared with the healthy condition (Figure 6A and B). As compared with the lesion group, hCDNF gene transfection increased βIII-tubulin immunofluorescence, which was significant from day 30 post-transfection and reached 80% of the healthy condition (Figure 6A and B). Western blot results of βIII-tubulin repeated the immunofluorescence pattern (Figure 6C) and also revealed a significant increase in GAP43p, a marker of axon growth and regeneration (Kawasaki et al., 2018), on days 15 and 30 post-transfection (Figure 6D). The TH immunofluorescence pattern in all the experimental groups (Figure 6A and E) was consistent with those shown in Figures 3C and 4B–C. These results suggest that hCDNF promoted dopamine neuron branching growth, consistent with the increased area density in the SNc (Figure 4A and C) and striatum (Figure 5).
Figure 7|hCDNF gene transfection restores BDNF levels in nigral dopamine neurons of rats with 6-OHDA lesion.

The double immunofluorescence analysis in the SNc showed that the primary source of BDNF is dopamine neurons (Figure 7A), confirming previous reports (Seroogy et al., 1994; Numan and Seroogy, 1999). Therefore, the 6-OHDA lesion decreased the number of BDNF-expressing TH+ cells but maintained high BDNF levels in TH– cells that decreased by 75% at the end of the study (L81) compared with the L21 condition (Figure 7A). Compared with the L81 condition, BDNF gain was 50% significantly higher on day 15 after hCDNF gene transfection and increased to 75% of healthy condition values on day 60 post-transfection (Figure 7A and B). At this time, most BDNF immunoreactivity was present in TH+ cells, whose recovery pattern was similar to those shown above (Figures 3–6). These results suggest that BDNF recovery also contributes to the hCDNF-induced reversal of nigrostriatal dopamine neurodegeneration as shown by the gradual increase in relative TH IFAD (Figure 7C).