脑损伤
-
Figure 1|Effects of BG on motor function and BSCB permeability in a rat model of SCI.
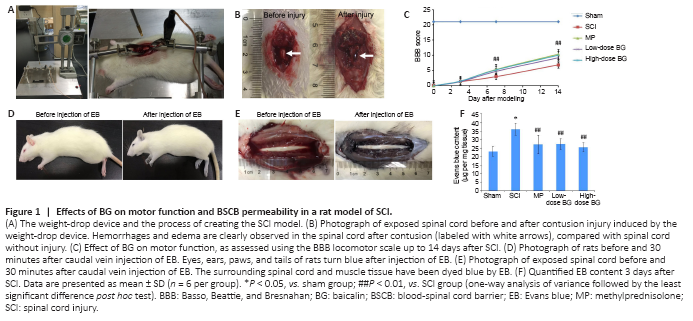
The procedure for generating SCI model rats is shown in Figure 1A. After striking the spinal cord, a visible edema and hemorrhage occurred within a few seconds (Figure 1B). After SCI, both motor and bladder functions exhibited significant defects. Specifically, no observable hindlimb movement was observed in SCI, MP, or low- and high-dose BG groups, all of which had BBB scores of 0 on the day of surgery (Figure 1C). Among the rats, two joints, two hips, and two knees were irresponsive, and posterior limbs could only drag on the floor. At the same time, because SCI rats lost the ability to urinate by themselves, soft bladder compression manually twice a day was necessary to prevent uroschesis. From days 7 to 14, BBB scores indicated that administration of both low-dose and high-dose BG significantly relieved motor disturbances in the posterior limb (P < 0.01, vs. SCI group). The effect of high-dose BG was equivalent to that of MP treatment (P = 1.000).
After harvesting spinal cords 3 days post-injury, EB solution was injected into the caudal veins of all rats. As showed in Figure 1D, eyes, ears, paws, and tails of the SCI rats turned blue within 10 seconds after EB injection. This phenomenon indicated that EB dye was distributed to the whole body through the blood vascular system in a very short time. After 30 minutes of circulation, the spinal cord and the surrounding muscle tissue were clearly dyed blue in the SCI, MP, and BG groups. This was in sharp contrast with the clear white spinal cord and pink muscle tissue before EB injection (Figure 1E).
In the sham group, although vertebral lamina at spinal cord levels T9–10 was removed in SCI surgery, no strike was conducted and the BSCB remained relatively intact. Thus, most of the EB was hindered by the physical barrier and only a small amount was detected in the spinal cord tissues 3 days after surgery. In contrast, the BSCB of rats in the SCI, MP and BG groups was damaged by the weight-drop, which resulted in a significant increase in spinal cord EB content 3 days after SCI (P < 0.05, vs. sham group). However, compared with the SCI group, intraperitoneal injection of BG for 3 consecutive days, resulted in significantly less EB content for both the low- and high-dose BG groups (P < 0.01, vs. SCI group; Figure 1F). The effects of low- and high-dose BG were comparable with those of MP. This result indicated that BG (50 or 200 mg/kg) could decrease the permeability of destroyed BSCB, which was helpful for SCI recovery.
Figure 2|Effect of BG on tight junction and apoptosis proteins in rat spinal cord 3 days after SCI.
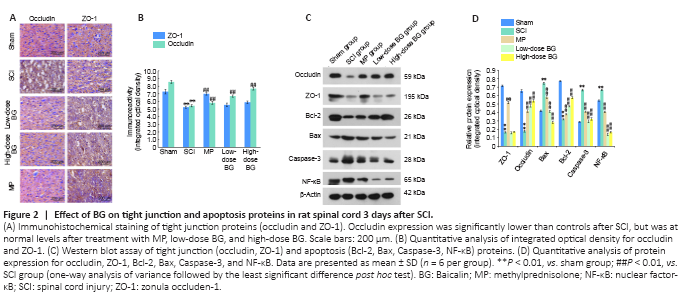
Changes in protein expression levels for TJ proteins (occludin and ZO-1) were evaluated by immunohistochemical assay and western blot 3 days after SCI. IOD values showed that TJ protein expression in gray matter of the spinal cord tissue was significantly less after SCI (P < 0.01, vs. sham group). Reduced occludin expression was significantly recovered both by low-dose and high-dose BG administration (P < 0.01, vs. SCI group). However, BG did not counter the change in ZO-1 expression (P = 0.168 and 0.534, respectively for low-dose and high-dose BG groups vs. SCI group; Figure 2A and B). Western blot results confirmed these finding.
Expression levels of apoptosis-related proteins in the spinal cord were also measured by western blot assay 3 days after SCI. We found that the IODs for Caspase-3, NF-κB, and Bax were significantly greater after injury, while Bcl-2 levels were significantly lower (All Ps < 0.01, vs. sham group). After 3 continuous days of BG treatment, these trends were completely reversed (P < 0.01, vs. SCI group). The effect of BG on the expression of these important apoptosis-associated proteins was equivalent to that of MP (Figure 2C and D).
Figure 3|Effect of BG on apoptosis in the spinal cord of the rat model of SCI.
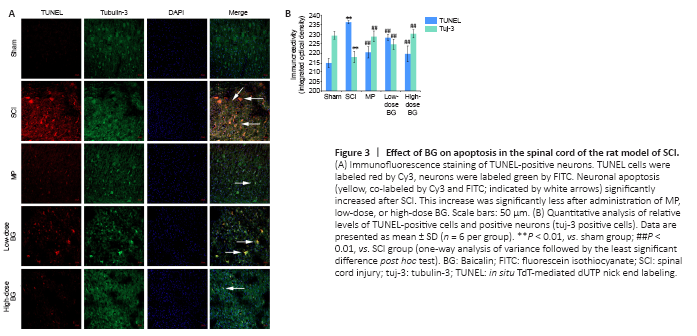
Neuronal apoptosis was assessed 3 days post-SCI. TUNEL and tubulin-3 were co-labeled in spinal cord sections. While the sham group exhibited little neuronal apoptosis, injured rats exhibited significantly more neuronal apoptosis (labeled red by Cy3 in Figure 3A). Compared with the SCI group, administering MP or BG resulted in significantly fewer numbers of neurons positively labeled by TUNEL (P < 0.01). The effect of high-dose BG was equivalent to that of MP (P = 0.598, Figure 3B).
Figure 4|Dose-effect and time-effect relationship of glutamate (Glu) and BG on cell viability of SH-SY5Y cells.

Appropriate concentrations and time points for Glu and BG were determined according to the results of the cell-viability assay. Nine concentrations (0.01, 0.05, 0.1, 0.5, 1, 5, 10, 50, and 100 mM) and two time points (12 and 1 hour) were assayed for excitotoxicity. As shown in Figure 4A, following exposure to Glu for 12 hours, cell viabilities at all concentrations were below 100%, and compared with the control group, cell viability decreased by half at 10 mM Glu. In contrast, following exposure to Glu for 1 hour, although cell viability declined along with increased Glu concentrations, the numeric values were still above 100% at the concentration range of 0.01–5 mM. Therefore, 10 mM and 12 hours were selected for the excitotoxicity model using SH-SY5Y cells.
BG was used to treat SH-SY5Y cells after building the excitotoxicity model with Glu. Cell viability was assayed under eight BG concentrations (0.1, 1, 5, 10, 20, 25, 40, 50 μM) and three time points (24, 48, 72 hours). As shown in Figure 4B, cell viability was significantly higher at 48 and 72 hours than at 24 hours. Meanwhile, cell viability gradually increased with BG concentration, and reached a peak at 40 μM. Therefore, 40 μM and 48 hours were selected as appropriate concentration and treatment time to analyze the effects of BG on the excitotoxicity model of SH-SY5Y cells.
SH-SY5Y control cells in normal conditions possess typical epithelioid cell morphology. After treatment with Glu, the vast majority of cells shrunk and became round in shape. In the BG-treated cells, excitotoxicity caused by Glu was alleviated and cell morphology was similar to that of the control cells. In the cells treated with BG and LY294002, the cell morphology was an intermediate between what was observed in the Glu-treated and BG-treated cells (Figure 4C).
Figure 5|Effect of BG on tight junction protein in SH-SY5Y cells.
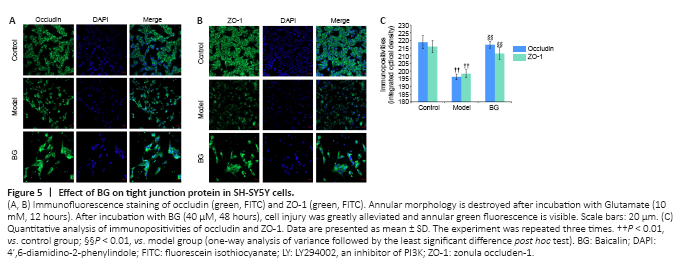
In the control cells, green fluorescence of TJ proteins was observed in cell membranes, which looked like many loops gathered together. After treating with 10 mM Glu for 12 hours, most of the annular morphology of green fluorescence disappeared because of the Glu-induced excitotoxicity. However, in the cells treated with BG, cell injury was greatly alleviated (40 μM, 48 hours), as evidenced by the undisturbed annular green fluorescence (Figure 5A and B). These changes were verified by analysis of the IODs for occludin and ZO-1 (Figure 5C).
Figure 6|Effect of BG on PI3K/Akt signaling with respect to restoring the blood-spinal cord barrier and to anti-apoptosis in SH-SY5Y cells.
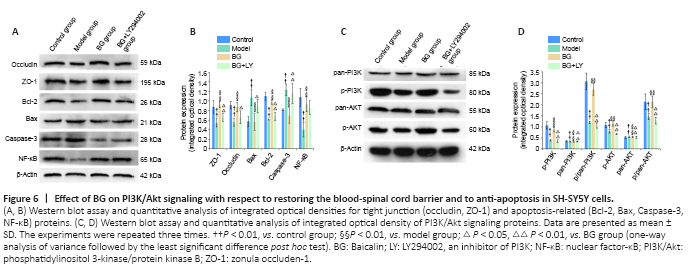
Western blot results also confirmed these findings. BG treatment significantly rescued the reduction in occludin and ZO-1 expression that was observed in Glu-treated SH-SY5Y cells. Additionally, this effect was blocked by the PI3K inhibitor LY294002 (P < 0.01, vs. BG group; Figure 6A and B). However, it is worth noting that western blot results for TJ proteins in SH-SY5Y cells did not completely coincide with that in the SCI model rats; in spinal cord tissue, rescue of BG on ZO-1 expression was not significant (P = 0.091 and 0.186, respectively for the low-dose and high-dose BG groups vs. SCI group, vs. SCI group; Figure 2C and D).