神经损伤与修复
-
Figure 1|Cell locations and phenotypes sampled.
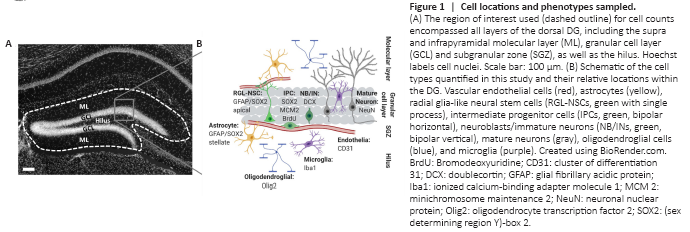
We used immunohistochemistry to identify cells across all layers of the DG expressing phenotypic markers of major DG lineages: neural, astroglial, oligodendroglial, microglial, and vascular endothelial (Figure 1). The mean number of cells counted, measured tissue thickness, distribution of cells throughout the tissue thickness, and Gundersen-Jensen error estimates are reported in Table 2.
Figure 2|Representative images of immunolabeling for all cell types surveyed.
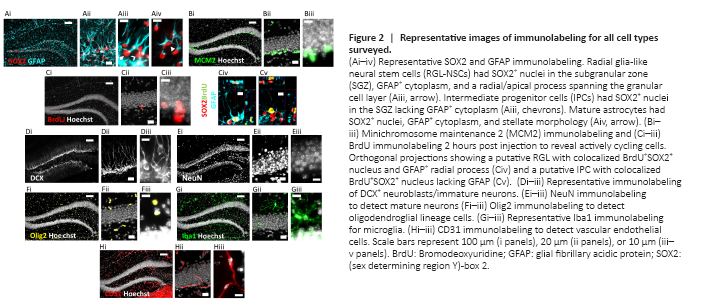
Because many of the protein markers expressed by adult neural precursors are also present in mature astrocytes (Semerci and Maletic-Savatic, 2016), we distinguished these cell populations based on a combination of SOX2 and GFAP immunolabeling along with cell morphology (Suh et al., 2007; Figure 2Ai–iv). As expected, RGL-NSC cell bodies were solely located in the subgranular zone (SGZ) with a radial/apical process extending into the granule cell layer (Figure 2Aiii). The IPC progeny of RGL-NSCs were also located in the SGZ (Figure 2Aiii). Mature protoplasmic astrocytes with SOX2+ nuclei were located in all regions of the DG (Figure 2Aiv). We found that mature astrocytes were the most abundant of these three populations (8274.7 ± 1109.7, 9232.4 ± 1095.1 cells/mm3, females and males, respectively) followed by IPCs (4532.2 ± 469.7, 5220.1 ± 820.2 cells/mm3), then RGL-NSCs (1364.9 ± 132.0, 1228.6 ± 59.5 cells/mm3, Figure 3A). Males and females did not significantly differ in number of astrocytes (t = 0.61, P > 0.05), RGLs (t = 1.02, P > 0.05), or IPCs (t = 0.68, P > 0.05).
To expand the quantification of progenitor cells, we used two markers of cellular mitosis. The adult DG contains various populations of mitotically active cells, which can be identified using endogenous cell cycle markers such as minichromosome maintenance 2 (MCM2) or the exogenous S phase marker bromodeoxyuridine (BrdU) (von Bohlen und Halbach, 2011; Kuhn et al., 2016). Previous studies have shown that the majority of MCM2+ or acutely BrdU-labeled cells in the DG are IPCs located within the SGZ, with a sparser number of proliferative glial cells located outside the SGZ (Mandyam et al., 2007; Bonaguidi et al., 2011). Consistent with these previous findings, we found MCM2+ cells throughout the entire DG, but the greatest density was found within the SGZ (Figure 2Bi–iii). To obtain counts most directly related to IPC number, only MCM2+ cells in the SGZ were quantified. The density of MCM2+ cells in the SGZ did not significantly differ between females and males (4324.1 ± 1106.9 vs. 3740.7 ± 356.8 cells/mm3; t = 0.55, P > 0.05) (Figure 3A). We obtained similar results quantifying BrdU+ cells after a single BrdU injection 2 hours before perfusion. BrdU labeled cells were found throughout the entire extent of the DG, but most commonly within the SGZ (Figure 2Ci–iii). The density of BrdU-labeled cells in the SGZ was not different between females and males (658.4 ± 61.9 vs. 597.3 ± 162.1 cells/mm3; t = 0.32, P > 0.05) and represented a smaller subset of cells than all cycling (i.e. MCM2+) cells, as expected (Figure 3A). Colocalization analysis revealed that ~88% of BrdU-labeled cells in the SGZ were SOX2+GFAP– putative IPCs (87.9 ± 1.2% females, 88.7 ± 1.3% males, Figure 3F), consistent with previous studies (Encinas et al., 2011), which suggests that counts of BrdU+ cells in the SGZ are most directly related to numbers of IPCs in S phase. BrdU-labeled cells outside of the SGZ could represent glial progenitor cells in S phase but were too sparse for reliable quantification.
In the DG, doublecortin (DCX) marks neuroblasts (NBs) and recently born, immature granule neurons (INs), while NeuN marks the nuclei of various mature neuronal subtypes, the most abundant of which is mature granule neurons (Kuhn et al., 2016). As expected, DCX+ cells were located within the SGZ and inner third of the granular cell layer (Figure 2Di–iii). The density of DCX+ cells was similar in scale to MCM2+ and SOX2+ IPCs and did not significantly differ between females and males (4820.5 ± 656.4 vs. 4924.7 ± 376.0 cells/mm3, t = 0.15, P > 0.05; Figure 3A). Mature NeuN+ neurons were located mostly within the GCL, likely representing granule neurons, with sparse cells in the hilus and molecular layer, likely representing hilar mossy neurons and various subclasses of interneuron (Figure 2Ei–iii). The density of NeuN+ cells was at least 10-fold greater than that of all other cell types quantified here and did not significantly differ by sex (100,564.5 ± 21,696.6 vs. 115,109.3 ± 29,242.0, females vs. males, t = 0.24, P > 0.05; Figure 3C).
We identified cells of the oligodendroglia lineage including oligodendrocyte progenitor cells, newly formed oligodendrocytes, and mature myelinating oligodendrocytes based on Olig2 immunolabeling (Valério-Gomes et al., 2018). Olig2+ cells were mainly distributed throughout the molecular layer and hilus of the DG (Figure 2Fi–iii). The density of oligodendroglia lineage cells was most similar to that of MCM2+ and SOX2+ IPCs as well as DCX+ NB/INs and not different between females and males (4125.9 ± 1213.0 vs. 2610.7 ± 333.1 cells/mm3, t = 1.34, P > 0.05; Figure 3A).
To quantify microglia, we used Iba1 immunolabeling, which can also detect resident perivascular or infiltrating macrophages. However, in the DG of healthy, young mice, Iba1 labeling is most directly linked to microglia number as infiltrating macrophages are rare and perivascular macrophages occupy a specific spatial compartment around blood vessels distinct from parenchyma-residing microglia (Galea et al., 2005). Iba1+ cells were distributed throughout every region of the DG (Figure 2Gi–iii) and were intermediate in density between oligodendroglial lineage cells and IPCs and RGLs. No sex difference was found in Iba1+ cell density (2677.1 ± 892.1 vs. 1816.8 ± 210.2 cells/mm3, females vs. males, t = 1.05, P > 0.05; Figure 3A).
Vascular endothelial cells within the DG were identified by CD31 immunolabeling and formed vascular networks throughout all regions of the DG (Figure 2Hi–iii). The density of CD31+ cells was most similar to SOX2+ IPCs and DCX+ NB/INs, with no sex difference (6768.7 ± 1067.3 vs. 5849.0 ± 639.4 cells/mm3, females vs. males, t = 0.78, P > 0.05; Figure 3A).
Figure 3|Quantification of astroglial, neural stem and progenitor cell, neuroblast/immature and mature neuronal, oligodendroglial, microglial, and endothelial cell density in the dentate gyrus.
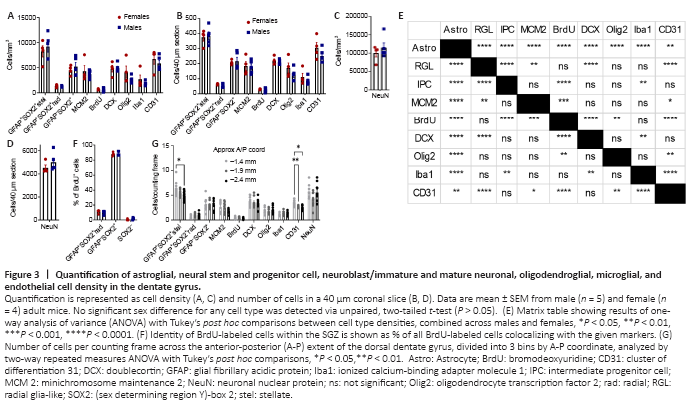
Cell density estimates for each cell marker quantified in the current study are depicted in Figure 3A and C. The results of statistical analysis for differences in cell density between cell types are depicted in Figure 3E. To facilitate comparisons with counts performed in sections cut to a commonly used thickness for free-floating immunohistochemistry, data is also presented as estimates of cell number in a 40 μm slice (Figure 3B and D). We also determined the relative cell densities across the anterior-posterior extent of the dorsal DG (Figure 3G). GFAP+SOX2+ stellate astrocytes and CD31+ endothelia were the only cell types to show variance by anatomical position, both decreasing in density at the posterior pole of the dorsal DG. We did not detect significant sex differences for any of the cell types quantified. To understand the robustness of this finding, we used our data to inform power analyses to estimate sample size required to detect sex differences in each cell type density. Using our data to estimate means and pooled variance, we found that the sample sizes required to detect sex differences with 80% power and alpha of 0.05 were substantially larger than those used in the present study (Table 3). Our sample size would need to increase by 4 to > 300 fold to be powered for detection of sex differences using the current methodology.