脑损伤
-
Figure 1|Schematic diagram of needle insertion technique and location of acupoints.

Thirty-eight mice were treated with EA within 2 hours of stroke induction and for analysis. The mice were anesthetized with isoflurane and then placed in the prone position. Following routine sterilization of the scalp and neck, a disposable aseptic acupuncture needle (φ 0.18 × 10 mm) was inserted at GV20 (located at the midpoint of the line connecting the tip of the mouse ear) with needle angle 15° to a depth of 2 to 3 mm and GV14 (located at the depression under the spinous process of the seventh cervical vertebra) with needle angle 45° to a depth of 2 to 3 mm (Figure 1) (Wang et al., 2014; Chang et al., 2018). EA stimulus was delivered for 15 minutes using the HANS EA apparatus (HANS-200A/100B, HANS, China) with the following parameters: sparse wave, 2 Hz; dense wave, 10 Hz; and current, 1 mA. The mice showed visible muscle contraction near the acupoint during stimulus (Xing et al., 2018).
Figure 2|EA improves cerebral blood perfusion and S1-M1 coherence in mice within 24 hours of unilateral focal photothrombotic infarct in M1.
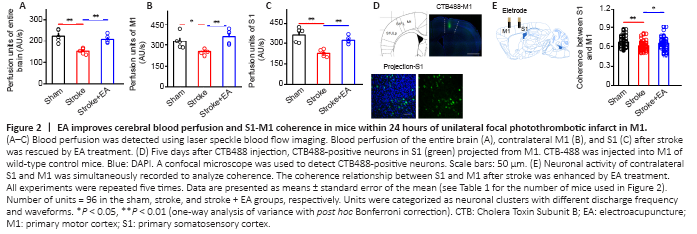
The decrease in blood perfusion of the entire brain, M1, and S1 following stroke induction was significantly rescued by EA at acupoints GV14 and GV20 (P < 0.01) (Figure 2A–C and Additional Figures 1 and 2). To confirm the structural connection between bilateral S1 and M1 after M1 infarction, CTB488 tracer was injected into left M1. CTB-488-positive neurons were obviously observed in S1 (Figure 2D). Interestingly, we also found CTB488-positive neurons in contralateral S1. The number of CTB488-positive neurons between the ipsilateral and contralateral S1 did not differ (P > 0.05) (Additional Figure 3). This demonstrated monosynaptic projection from S1 to M1. To further explore the functional connection between the contralateral M1 and S1, we evaluated coherence between S1 and M1 by recording neuronal activity in these two regions simultaneously in vivo. Compared with the sham group, the coherence between S1 and M1 was greatly disturbed in the stroke group (P < 0.01). EA at GV14 and GV20 acupoints inhibited this attenuation (P < 0.05) (Figure 2E).
Figure 5|EA increases neuronal firing in the contralateral M1 and S1 within 24 hours of unilateral focal photothrombotic infarct in M1 (electrophysiological recording in vivo).
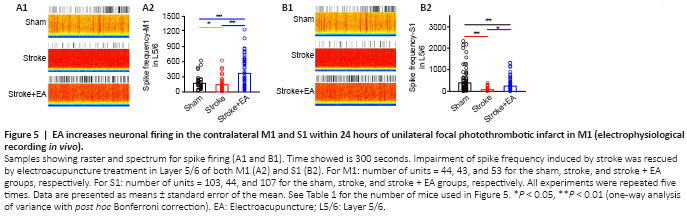
The above results showed that activity in Layer 2/3 showed no change in vitro (Figures 3A and 4A). Considering these results, and that spontaneous neuronal activity in Layer 2/3 is sparse in acute electrophysiological recording manipulation (Crochet et al., 2011; Barth and Poulet, 2012), we focused our in vivo recordings on firing rate and waveform of interneurons and pyramidal neurons in Layer 5/6. Excitatory neuronal activity in the contralateral M1 and S1 of Layer 5/6 was significantly lower in the stroke group than the sham group (P < 0.05 and P < 0.01, respectively). In the stroke + EA group, neuronal activity was significantly higher in both contralateral M1 and S1 of Layer 5/6 compared with the stroke group (P < 0.01 and P < 0.05, respectively; Figure 5). Inhibitory neuronal activity in S1 and M1 showed impairment in the stroke group compared to the sham group (P < 0.01 and P < 0.05, respectively). This impairment was recovered to some extent in the stroke + EA group (Additional Figure 5).
Figure 6|After S1 ablation, EA treatment at GV14 and GV20 does not enhance neuronal activity or blood perfusion of contralateral M1 and S1 within 24 hours
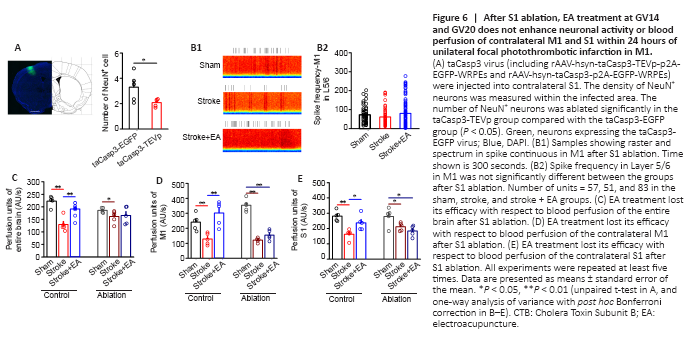
The neurons in S1 were significantly ablated in the taCasp3-TEVp group compared with the taCasp3-EGFP group (P < 0.05; Figure 6A). After S1 ablation, impairment of neuronal activity (including excitatory and inhibitory neurons) in M1 caused by stroke induction was absent and EA treatment showed no efficacy (Figure 6B and Additional Figure 6). This suggests that S1 function is crucial for modulating neuronal activity in M1.
In the control group (rAAV-hsyn-taCasp3-p2A-EGFP-WRPEs virus injection), blood perfusion of the entire brain was significantly lower in the stroke group than the sham group (P < 0.01) but significantly higher in the stroke + EA group than the stroke group (P < 0.01; Figure 6C). Local M1 and S1 perfusion showed similar changes among the groups (Figure 6D and E). However, after ablation, although the blood perfusion was significantly lower in the stroke group (P < 0.01 or P < 0.05), blood perfusion recovery mediated by EA at GV14 and GV20 disappeared in the entire brain, contralateral M1, and S1 (Figure 6C–E).