脊髓损伤
-
Figure 1|Experimental procedure and the OFS implantation.

Healthy 6-month-old adult clean-grade Sprague-Dawley rats, weighing 220 ± 10 g were provided by the Experimental Animal Center of the Chinese Academy of Military Medical Sciences (Beijing, China). This study was approved by the Animal Experiments and Experimental Animal Welfare Committee of Capital Medical University (approval No. AEEI-2021-204). All surgical procedures were conducted according to the guidelines of the National Guidelines for Experimental Animal Welfare. The animal feeding and experimental surgeries were completed in the Animal Laboratory of the China Rehabilitation Research Center. Pentobarbital sodium (1%, Chinese Institute of Rehabilitation Science) was injected intraperitoneally at 30 mg/kg of body weight for anesthesia.The rats had free access to food and water throughout the study. The rats (n = 120) were randomly divided into OFS + SCI and SCI groups (n = 60 per group). The OFS + SCI group received the OFS intervention, while the SCI group received sham stimulation (Figure 1A).
Rat models of spinal cord contusion were made according to the modified Allen method at T10 (Perot et al., 1987).After anesthesia and being fixed on the NYU impactor (New York University, USA), an SCI model was created using 50 g-cm of potential energy. After spinal cord impingement, the stimulator electrodes were implanted rostral and caudal to the injury site by suturing one to the bilateral facet capsule and the other to the interspinous ligament (Figure 1B and C). The OFS + SCI rats were implanted with a working stimulator and the SCI rats received a sham stimulator. The positions of the electrodes were confirmed by X-ray.
Figure 2|Effect of OFS on locomotor function (BBB score) and neural conduction (MEP).
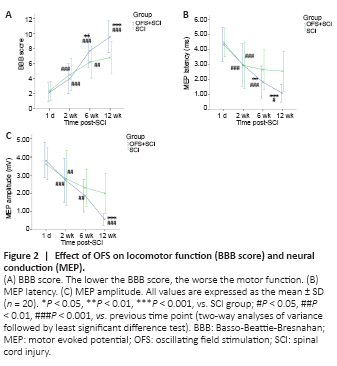
After OFS, BBB scores increased gradually in the OFS + SCI group and were higher than those in the SCI group. The two-way ANOVA revealed significant main effects of time (F(3,312) = 148.516, P < 0.001) and group (F(1,312) = 16.477, P < 0.001) on BBB score, as well as a significant group × time interaction (F(3,312) = 12.583, P < 0.001). The least significant difference post hoc test showed that the BBB score increased over time. The simple effects analysis showed statistically significant differences in BBB score at each time point for the OFS + SCI group (P < 0.001). BBB score was the highest at 12 weeks. In the SCI group, BBB score increased gradually, and differed significantly between day 1 and week 2 (P < 0.001), and between weeks 2 and 6 (P < 0.01) but did not differ between weeks 6 and 12 (P = 0.675). Additionally, although BBB score did not differ significantly between the two groups at 1 day or at 2 weeks (day 1: P = 0.648; week 2: P = 0.209), scores were significantly higher in the OFS + SCI group than in the SCI group at 6 and 12 weeks (week 6: P < 0.01, week 12: P < 0.001; Figure 2A).
As with BBB score, two-way ANOVAs were used to assess group and time differences in the latencies and amplitudes of evoked MEPs in the electrophysiological experiment. first, we found main effects of time (F(3,312) = 70.443, P < 0.001) and group (F(1,312) = 20.101, P < 0.001) on MEP latency, as well as a significant group × time interaction (F(3,312) = 6.428, P < 0.001). Post hoc analysis showed that latencies differed significantly between day 1 and week 2 (P < 0.001), between weeks 2 and 6 (P < 0.001), and between weeks 6 and 12 (P < 0.05; Figure 2B). The simple effects analysis showed that latencies for the OFS + SCI group differed significantly between different time points (day 1 vs. week 2: P < 0.001; week 2 vs. week 6: P < 0.001; week 6 vs. week 12: P < 0.05). Conversely, latencies for the SCI group only differed significantly between day 1 and week 2 (P < 0.001) (week 2 vs. week 6: P = 0.868; week 2 vs. week 12: P = 0.615; week 6 vs. week 12: P = 0.999). Significant differences in latency were observed between the two groups at 6 weeks (P < 0.01) and at 12 weeks (P < 0.001; Figure 2B).
As with latency, we found significant main effects of time (F(3,312) = 79.692, P < 0.001) and group (F(1,312) = 14.928, P < 0.001) on MEP amplitude, as well as a significant time × group interaction (F(3,312) = 9.606, P < 0.001). The least significant difference test showed that amplitudes differed significantly across time points (P < 0.001). The simple effects analysis showed that MEP amplitudes in the OFS + SCI group differed significantly different at certain time points (day 1 vs. week 2: P < 0.001; week 2 vs. week 6: P < 0.01; week 6 vs. week 12: P < 0.001). In the SCI group, statistically significant differences were observed between day 1 and week 2 (P < 0.01), and between weeks 2 and 12 (P < 0.01) but not between weeks 2 and 6 (P = 0.160) or between weeks 6 and 12 (P = 0.696). No differences in amplitude were observed between the two groups at 1 day (P = 0.602), 2 weeks (P = 0.943), or 6 weeks (P = 0.055). However, differences were statistically significant between the two groups at 12 weeks (P < 0.001; Figure 2C).
Figure 3|Effect of OFS on the histological morphology of injured spinal cords in SCI rats (hematoxylin and eosin staining).
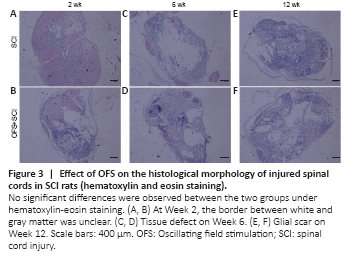
No significant differences were observed between the two groups under hematoxylin-eosin staining. The border between white and gray matter was unclear at 2 weeks (Figure 3A and B). A tissue defect was observed surrounded by a small amount of white matter at 6 weeks (Figure 3C and D). A glial scar was found at the site of injury at 12 weeks (Figure 3E and F).
Figure 4|Effect of OFS on NF200-positive nerve fibers in the injured spinal cord of SCI rats (immunohistochemical staining).
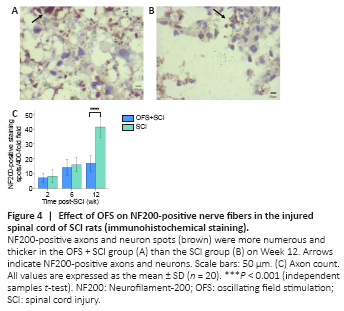
NF200-positive nerve fibers in the white matter were observed in both groups at different time points. The NF200 positive nerve-fiber density was higher in the OFS + SCI group than in the SCI group at 12 weeks (Figure 4A and B). In the independent samples t-test, the number of axons did not differ significantly at 2 weeks (P = 0.206) or 6 weeks (P = 0.278). However, at 12 weeks, axon count was significantly higher in the OFS + SCI group than in the SCI group (P < 0.001; Figure 4C).
Figure 5|Effect of OFS on GFAP-positive astrocytes in injured spinal cords of SCI rats.
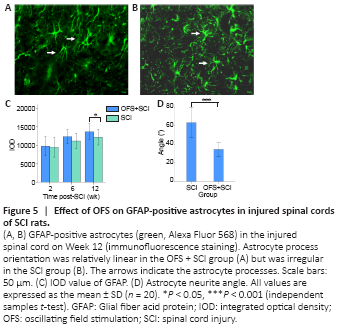
Using immunofluorescence staining, we determined the IOD value for GFAP (Figure 5A and B). An independent samples t-test showed that IOD did not differ significant at 2 weeks (P = 0.736) or at 6 weeks (P = 0.067). However, at 12 weeks, IOD was significantly lower in the OFS + SCI group than in the SCI group (P < 0.05), which indicates less astrocyte proliferation (Moriarty and Borgens, 2001) (Figure 5C).
We measured the angles of the astrocyte processes on the GFAP immunofluorescence-stained photos and compared them to evaluate the level of linear orientation in the astrocytes. An independent samples t-test showed that the angles in the OFS + SCI group were smaller than those in the SCI group at 12 weeks (P < 0.001; Figure 5D), which indicates more linear cell orientation.