脊髓损伤
-
Figure 2|Effect of combination of myelin-associated glycoprotein and chitin conduit on the pathology of regenerated nerve fibers in proximal nerve stumps 8 weeks postoperatively.
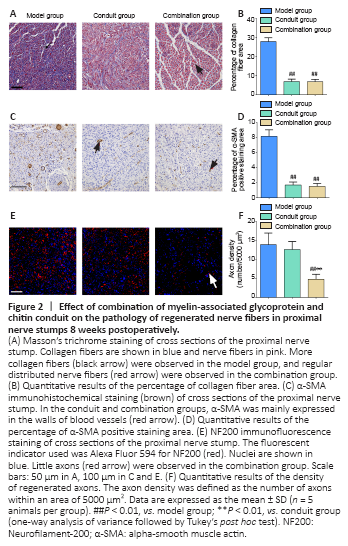
The Masson’s trichrome staining analysis revealed that plenty of collagen fibers and regenerated nerve fibers were disorderly distributed in the model group. In the conduit group, nerve fibers were also distributed in a disorganized manner. However, nerve fibers showed regular distribution in the combination group (Figure 2A). As shown in Figure 2B, the percentage of collagen fiber area in the combination group was significantly lower than that in the model group (P < 0.01), while the difference between the combination and conduit groups was not significant (P > 0.05).
As shown by the immunohistochemical analysis, α-SMA was abundantly detected in the model group. In the conduit and combination groups, α-SMA was mainly expressed in the walls of blood vessels (Figure 2C). As shown in Figure 2D, the percentage of α-SMA positive staining area in the combination group was significantly lower than that in the model group (P < 0.01), while the difference between the combination and conduit groups was not significant (P > 0.05).
As shown by the immunofluorescent analysis, regenerated axons were densely distributed in the model and conduit groups, while regenerated axons were sparsely distributed in the combination group (Figure 2E). Results of the axon density analysis are shown in Figure 2F. Axon density in the combination group was significantly lower than that in the conduit and model groups (both P < 0.01), while there was no significant difference between the conduit and model groups (P > 0.05).
Figure 3|Effect of combination of myelin-associated glycoprotein and chitin conduit on the ultrastructure of regenerated axons in proximal nerve stumps 8 weeks postoperatively.
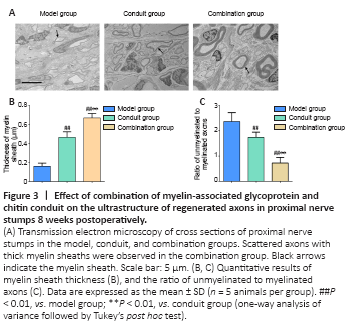
The ultrastructure characteristics of regenerated axons under the transmission electron microscope are illustrated in Figure 3A. As shown in Figure 3B, myelin sheath thickness in the combination group was significantly higher than that in the other two groups (both P < 0.01). Furthermore, myelin sheath thickness in the conduit group was significantly higher than that in the model group (P < 0.01). As shown in Figure 3C, the ratio of unmyelinated to myelinated axons in the combination group was significantly lower than those in the other two groups (both P < 0.01), and the ratio in the conduit group was lower than that in the model group (P < 0.01).