脑损伤
-
Figure 1|Study design and optogenetic stimulation in the contralesional anterolateral motor cortex (cALM).
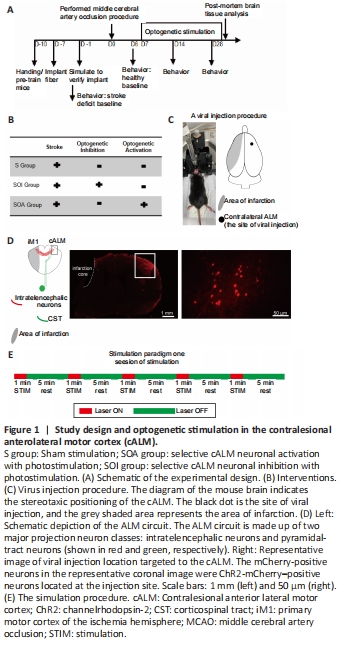
The MCAO mice were randomly divided into three groups: the sham-treatment group (Sham group), the selective neuronal inhibition with cALM group (SOI group), and the selective neuronal activation with cALM group (SOA group) (n = 6/group). A schematic of the experimental timeline is shown in Figure 1.
Figure 2|Effects of optogenetic cALM stimulation on behavior in MCAO mice.
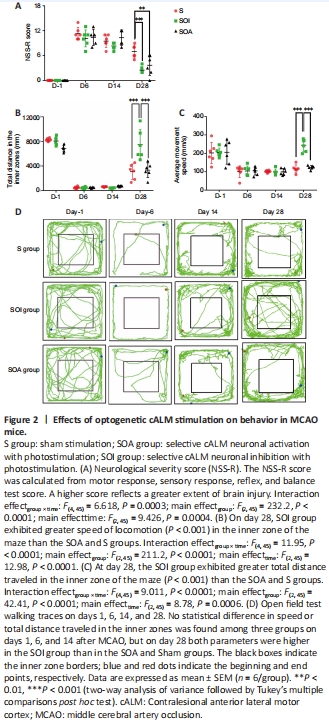
Behavior was evaluated on day 1 (the day before the MCAO surgery was performed) and days 6, 14, and 28 after MCAO (Figure 2A).
In the open field test, the speed and total distance traveled within the inner zones of the maze were analyzed. No statistically significant differences in speed or total distance were found among the three groups on days 6 and 14 after MCAO (P > 0.05). However, on day 28, speed (P < 0.001, vs. Sham; P < 0.001, vs. SOA) and total distance (P < 0.001, vs. Sham; P < 0.001, vs. SOA) were higher in the SOI group than in the SOA and Sham groups (Figure 2B and C). The walking tracks for mice from all three groups at different time points after MCAO are shown in Figure 2D.
Figure 3|Effects of optogenetic cALM stimulation on dendritic morphology in the ipsilateral M1 in MCAO mice.

The results from Golgi staining of layer V of the iM1 at 28 days after MCAO are shown in Figure 3A. The dendritic length was significantly longer in the SOI group than in the Sham group (P = 0.0156; Figure 3B). There was no significant difference in dendritic complexity at 20, 80, or 100 μm from the soma among the three groups (P > 0.05). The dendritic complexity at 40 and 60 μm was increased in the SOA group compared with the Sham group (40 μm: P < 0.05, 60 μm: P < 0.05; Figure 3C).
Net, dendritic spine length and numbers were analyzed, as dendritic spines represent an early adaptive response after stroke (Brown et al., 2008). Pyramidal neurons have both basal and apical dendrites. The spine length of apical dendrites in layer V of the iM1 area was significantly greater in the SOI group than in the SOA group (P = 0.0117), and the SOI group also exhibited more apical dendrite spines than did the Sham group (P = 0.0335; Figure 3D–F). However, there were no significant differences in basal dendritic spine numbers among the three groups (P > 0.05).
Figure 4|Effects of optogenetic cALM stimulation on synaptic connections in MCAO mice.
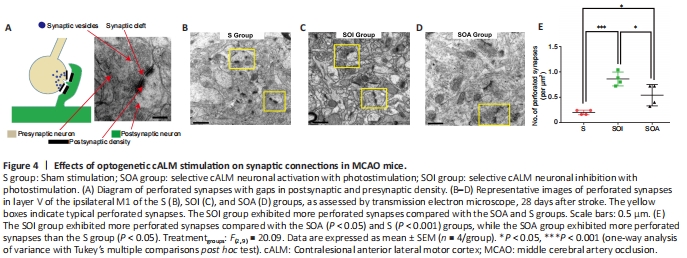
Perforated synapses exhibit discrete postsynaptic density, abundant AMPA receptors, and larger overall postsynaptic density regions, indicating increased functional efficacy and maturity. They are characterized by a discontinuous electron-dense plate at the postsynaptic membrane (Kim et al., 2018) (Figure 4A–D). Quantitative analysis showed that the SOI group had more perforated synapses than the Sham (P = 0.0004) and SOA groups (P = 0.032; Figure 4E).
Figure 5|Effects of optogenetic cALM stimulation on synaptic connections in MCAO mice.

MSBs were defined as multiple dendritic spines (postsynaptic partners) contacting the same axon terminal (presynaptic boutons independently, or boutons forming synaptic contacts with no less than two postsynaptic elements) (Kim et al., 2018) (Figure 5A–D). The SOA group exhibited more MSBs than the Sham (P = 0.0016) and SOI groups (P = 0.0163; Figure 5E).
Figure 6|Differentially expressed genes in the brain of MCAO mice after optogenetic cALM stimulation.

Transcriptome analysis yielded a total of 47.01 Gb of clean data (at least 6.8 Gb for each sample), and the percentage of Q30 bases was greater than 93.63%. In total, 4142 expressed genes were detected, including 3737 known genes and 405 new genes, as well as 16,008 expressed transcripts, including 9102 known transcripts and 6906 new transcripts. Approximately 95.4% to 96.96% of these transcripts mapped to the reference genome. A heat map of differential gene expression between the SOI and SOA groups is shown in Figure 6A. Four of the differentially expressed genes––FOS, ARC, Sema3f, and Egr1––had similar expression patterns, participated in the same metabolic process, and clustered together in the heatmap. GO analysis was performed to determine the top functions of the most significantly enriched genes (Figure 6B). For example, the top transcripts were highly enriched in transcripts corresponding to the GO term “positive regulation of biological processes”. This GO term also correlated with 163 genes that exhibited the highest number of enriched transcripts. The original gene expression data matrix is shown in Additional file 1. The GO term “positive regulation of biological process” was associated with 163 related genes, including FOS, ARC, Sema3f, Egr1, which were more highly expressed in the SOI group than in the SOA group, as determined by real-time quantitative reverse transcription PCR (FOS: P = 0.0003; Egr1: P < 0.001; ARC: P < 0.001; Sema3f: P < 0.001; Figure 6C).
Figure 7|Effects of optogenetic cALM stimulation on c-Fos expression in the ipsilateral M1 of MCAO mice.

The relative gene expression data are shown in Additional file 1 and Additional Table 1. FOS expression was also verified by immunofluorescence: FOS immunopositivity was higher in the SOI group than in the SOA group (P = 0.0072; Figure 7A–C).
点击此处查看全文