周围神经损伤
-
Figure 1|Flowchart describing the experimental procedures and animal assignment.
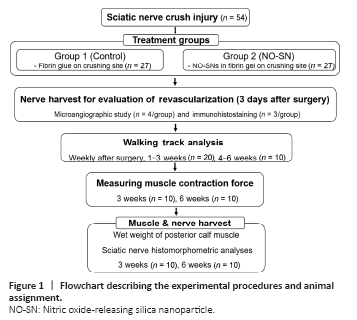
Fifty-four male Lewis rats weighing 250–300 g were randomly divided into two groups of 27 each and received a standardized sciatic nerve crushing injury, as described in Figure 1. The rats were anesthetized using isoflurane inhalation; animals were sedated with 5% isoflurane in a plastic chamber and then moved on to the surgical field for a survival procedure maintained under 3% isoflurane administered via a mask placed over the mouth. The right limb and buttock were shaved, washed with 70% ethanol, and prepared with povidone iodine. The sciatic nerve was carefully exposed around the trifurcation site using gluteal splitting. All rats received sciatic nerve crushing injury (6 mm in length) on a site just proximal to the trifurcation, made by closing a new smooth-tipped needle holder (Integra Miltex, Plainsboro, NJ, USA) to the third notch for 20 seconds (Sundem et al., 2016). Fibrin gel, a natural hydrogel, was subsequently applied around the crushed nerve, with and without NO-SNs. Only fibrin gel without NO-SNs was injected into animals of the control group: 1 μL of thrombin (T4648, Sigma-Aldrich, St. Louis, MO, USA; 50 U/mL in sterile water) was diluted with 37.5 μL of phosphate-buffered saline (PBS), and then, 12.5 μL of filtered fibrinogen solution (F8630, Sigma-Aldrich; 10 mg/mL in DPBS with Ca2+ and Mg2+) was added to the PBS-diluted thrombin solution just before the application of the gel to prevent pre-clotting. For the treatment of animals in the NO-treated group, NO-SNs were dissolved in PBS at a concentration 4/3-fold higher than the target concentration, and 37.5 μL of this solution was homogeneously mixed with 1 μL of thrombin. The same amount (12.5 μL, without NO-SNs) and concentration of fibrinogen solution as used in the control group was added to the mixture of thrombin and NO-SNs. The final concentration of NO in the fibrin gel was 70 μM. After confirmation of clotting of the fibrin gel around the crush site, the skin was sutured with 4-0 Prolene, which was removed 14 days after surgery. All rats received a single intramuscular injection of ketoprofen (5 mg/kg) for immediate postoperative pain control and enrofloxacin (5 mg/kg) to prevent postoperative infection. After the surgery procedures, rats were returned to their cages and raised in an environment with a 12-hour light/dark cycle and provided with food and water ad libitum.
Figure 2|Scanning electron microscopy images of the aggregated nitric oxide-releasing silica nanoparticles (bright) on the carbon tape (dark).
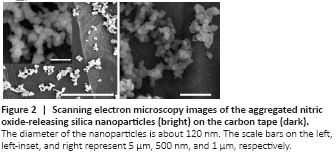
The total amount of NO (t[NO]) released from MAP3/NO nanoparticles was approximately 6.8 μM/mg, with a maximum NO flux ([NO]m) of 155,000 ppb/mg and a NO release half-life (t1/2) of 5 minutes. The diameter of MAP3/NO nanoparticles analyzed using scanning electron microscopy was approximately 120 nm (Figure 2), similar to the previously reported value (Shin et al., 2007).
Figure 3|The level of revascularization after treatment with NO-SNs.
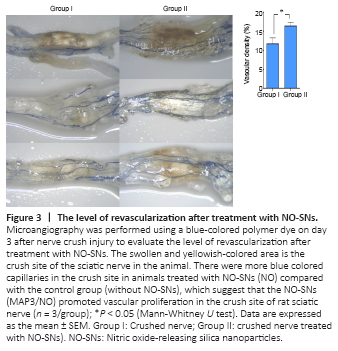
The results of microangiography are presented in Figure 3. Based on microangiography evaluation, the regenerated endoneurial vessels passing through the crushing injury site were identified in specimens from all animals, except in one control specimen which was improperly stained and thus excluded from the analysis. Relative to the control group, more vessels stained with blue dye were found in the NO-treated nerves. The vascular density at the crushing site of the sciatic nerve was significantly greater in the NO-treated group than in the control group (P < 0.05).
Figure 4|Revascularization after treatment with NO-SNs.
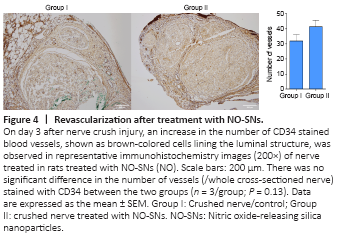
For direct identification of the newly formed vessels, immunohistochemical staining was performed targeting CD34, a marker for evaluating angiogenesis (Figure 4). The number of vessels stained with CD34 at the nerve sections in the control group is similar to the NO-treated group (P = 0.38).
Figure 5|Walking track analysis for the calculation of the SFI.
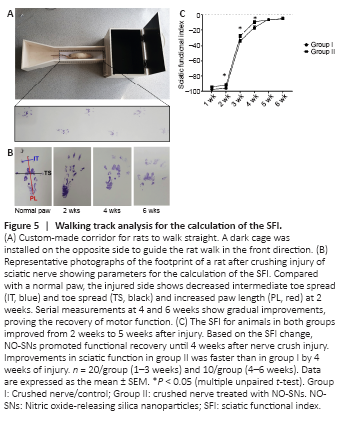
The SFI for animals in the control group improved from 2 weeks to 5 weeks after injury (from 2 weeks to 4 weeks after injury, P < 0.0001; from 4 weeks to 5 weeks after injury, P < 0.01) and the SFI for animals in the NO-treated group improved from 2 weeks to 4 weeks after injury (P < 0.0001). From 2 weeks to 4 weeks after injury, the SFI of animals in the NO-treated group exhibited a significant functional improvement compared to that in the animals of the control group (P < 0.05; Figure 5C). In summary, after crush injury, NO-SN treatment accelerated both revascularizations (3 days after injury, P < 0.01, Figure 3) and recovery of sciatic nerve function (from 2 weeks to 4 weeks after injury, P < 0.05; Figure 5). However, the SFIs of the NO-treated and control groups were identical at 5 weeks after injury (Figure 5C).
Figure 6|NO-SNs enhance muscle contraction force reduced by asciatic nerve crush injury.

As presented in Figure 6, NO-SNs enhanced the isometric tetanic muscle force of the TA at 3 and 6 weeks after injury, and a significant effect of NO-SNs was apparent, with a mean intergroup difference at 6 weeks after injury (P < 0.05).
Figure 7|NO-SNs prevent denervation-induced muscle atrophy.
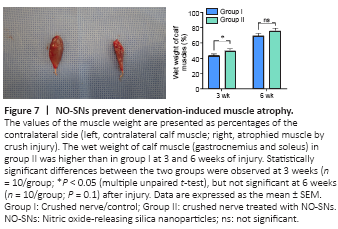
The wet weight of calf muscle (gastrocnemius and soleus) in animals of the NO-treated group was higher compared with that in the control group at 3 and 6 weeks after injury. However, a statistically significant difference between the two groups was observed only at 3 weeks (P < 0.05), but not at 6 weeks (P = 0.1; Figure 7) after injury.
Figure 8|NO-SNs promote the regeneration of myelinated axons and myelin repair.
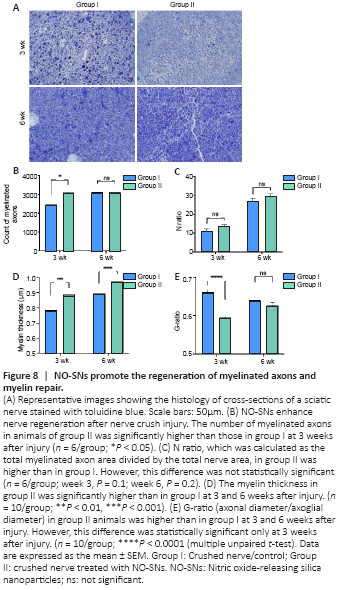
The number of myelinated axons and the N ratio increased over time in both groups (Figure 8B and C). The number of myelinated axons was significantly higher in animals treated with NO-SNs compared with the untreated animals 3 weeks after injury (P < 0.05; Figure 8B). However, this intergroup difference was not significant at 6 weeks after injury. The N ratio was higher in animals treated with NO-SNs compared with the untreated animals at 3 and 6 weeks after injury, but there was no significant difference between the two groups (Figure 8C). NO-SNs treated animals had significantly thicker myelin at 3 and 6 weeks after injury (P < 0.01; Figure 8D) and significantly lower G-ratio at 3 weeks after injury compared with the untreated animals (P < 0.0001; Figure 8E).