视神经损伤
-
Figure 1|PRISMA flow diagram for the selection of studies.
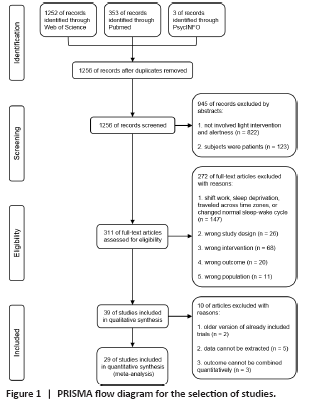
We imported all studies to EndNote X9 and removed duplicate records. Eligible studies were selected in two stages. Firstly, three authors (XDH, ZFH, and YMM) independently screened the title and abstract of each article identified by the systematic search. At this stage, we excluded all references that clearly did not fulfill the inclusion criteria. Secondly, the remaining full-text articles were further assessed independently by the same three authors (XDH, ZFH, and YMM). During both steps of the process, discrepancies were resolved by discussion, and decisions were made by the corresponding author (TQ). A flow chart illustrating the detailed selection process is depicted in Figure 1.
Figure 2| Meta-analysis of subjective alertness.
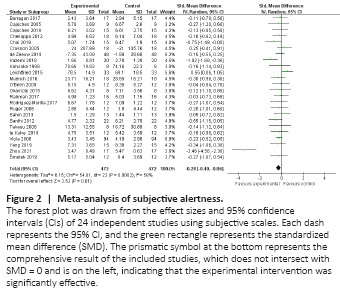
Figure 3| Funnel plot assessing publication bias of studies with subjective measures.
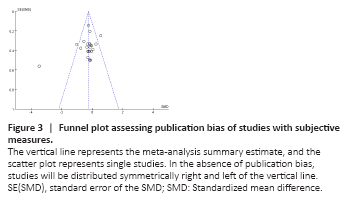
The meta-analysis of the pooled data from the 24 studies with subjective measures showed that light intervention can significantly improve subjective alertness (SMD = –0.28, 95% CI: –0.49 to –0.06, P = 0.01, I2 = 58%, REM; Figure 2). The effect size was robust, as assessed by the sensitivity analyses in which the “weak” studies with low quality were excluded (SMD = –0.28, 95% CI: –0.50 to –0.06, P = 0.01, I2 = 60%, REM). Using the funnel plot analysis of the outcome, the results showed that the funnel plot distribution was basically symmetrical, which indicated that the result was stable and reliable (Figure 3).
Figure 4| Meta-analysis of objective alertness.

Figure 5| Funnel plot assessing publication bias of studies with objective tests.
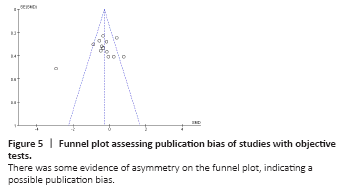
Although 15 studies used objective tests to assess alertness, data from 14 studies could be quantitatively combined. The aggregated data from these 14 studies showed that light intervention effectively improved objective alertness (SMD = –0.34, 95% CI = –0.68 to –0.01, P = 0.04, I2 = 74%, REM; Figure 4). The effect size was robust, as assessed by the sensitivity analyses in which the “weak” studies with low quality were excluded (SMD = –0.36, 95% CI = –0.73 to 0.00, P = 0.05, I2 = 75%, REM). The funnel plot results showed that the two sides of the graph were not completely symmetrical, which indicated a possible publication bias (Figure 5).