脑损伤
-
Figure 3| Expression and distribution of nNOS in the TRM.
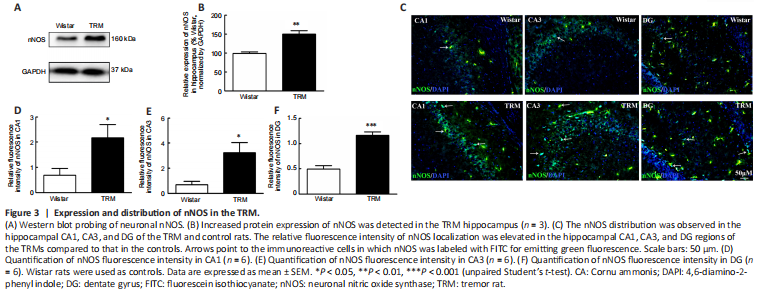
Next, we detected nNOS expression and distribution in the hippocampus of the TRMs and controls. According to the western blot, the hippocampal nNOS expression level was significantly higher in the TRM group (n = 3) than in the control group (n = 3, P = 0.0055; Figure 3A and B), which supported our bioinformatics analysis results. Immunofluorescence analysis showed that nNOS was widely distributed in the control and TRM hippocampal regions, including the CA1, CA3, and dentate gyrus (DG) regions (Figure 3C). The relative fluorescence intensity of nNOS was increased in the hippocampal CA1 (n = 6, Control vs. TRM, P = 0.0298; Figure 3D), CA3 (n = 6, Control vs. TRM, P = 0.0152; Figure 3E), and DG regions (n = 6, Control vs. TRM, P < 0.0001; Figure 3F) of the TRMs compared with that in the controls, in accordance with our western blot results. These findings indicate that nNOS is localized in the TRM hippocampus and may be involved in TRM epileptogenesis.
Figure 4| Mitochondrial dysfunction and enhanced MDA and LDH in the TRM hippocampus.
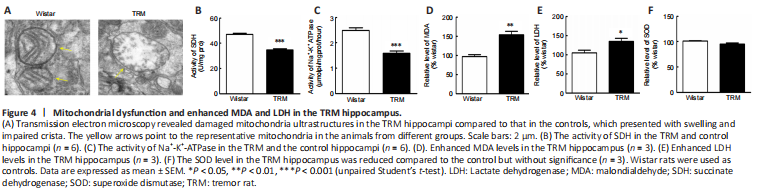
NO, which is synthesized by NOS, contributes to mitochondrial damage through electron transport chain inhibition and oxidative or nitrosative stress induction (Tengan and Moraes, 2017). Increasing evidence has indicated that oxidative stress caused by mitochondrial disorders may increase susceptibility to epilepsy (Yang et al., 2020). Given the vital role of mitochondria in both NO synthesis and seizure generation, we used transmission electron microscopy to observe the ultrastructural features of this organelle in epileptic animals. Mitochondria in the TRM hippocampus (n = 3) were damaged to different degrees compared with those in normal controls (n = 3), and presented with swelling and disrupted cristae (Figure 4A). Next, we analyzed whether the morphological changes contributed to abnormal mitochondrial function. We measured the activities of SDH and Na+-K+-ATPase, which are representative enzymes for metabolic processes when evaluating mitochondrial activity (Tian et al., 2015). The activity of each enzyme was markedly reduced (SDH, n = 6, Control vs. TRM, P < 0.0001, Figure 4B; Na+-K+-ATPase, n = 6, Control vs. TRM, P < 0.0001, Figure 4C) in the TRM group compared with that in the control group. Moreover, the secondary outcome of mitochondrial impairment usually includes an oxidase imbalance accompanied by abnormal levels of downstream enzymes, so we also determined the MDA, LDH, and SOD levels in the different groups. MDA and LDH levels were both increased (MDA, n = 3, Control vs. TRM, P = 0.0055, Figure 4D; LDH, n = 3, Control vs. TRM, P = 0.0491, Figure 4E) in the TRM group compared with those in the control group. However, the SOD level was not significantly altered (n = 3, Control vs. TRM, P = 0.1045, Figure 4F). Thus, our data demonstrated abnormal mitochondrial structure and elevated levels of oxidative stress markers in the TRM hippocampus.
Figure 5| nNOS inhibitor 7-NI reverses effect on MDA and LDH levels and ROS generation in PILO-treated N2a cells.

On the basis of the results above, which indicated that nNOS and oxidative stress were involved in the TRM, we speculated that blocking nNOS function might improve epilepsy-induced oxidative stress. Therefore, the nNOS inhibitor 7-NI was used to evaluate the potential influence of nNOS suppression. We initially performed a CCK8 assay using different concentrations of 7-NI in N2a cells to determine the optimal concentration (Figure 5A). We chose 100 μM as the appropriate working concentration because it was the highest concentration at which cell vitality was not affected in the N2a cells. PILO increased the relative content of MDA (n = 3, DMSO vs. PILO, P = 0.0011; Figure 5B) and LDH (n = 3, DMSO vs. PILO, P = 0.0003; Figure 5C) and decreased the level of SOD (n = 3, DMSO vs. PILO, P = 0.0052; Figure 5D). Application of 7-NI restored these abnormal oxidative stress index levels (MDA: n = 3, PILO vs. PILO + 7-NI, P = 0.0292; Figure 5B; LDH: n = 3, PILO vs. PILO + 7-NI, P = 0.0072; Figure 5C; SOD, n = 3, PILO vs. PILO + 7-NI, P = 0.0268; Figure 5D). Taken together, these results suggest nNOS inhibition with 7-NI had a neuroprotective effect against epilepsy-induced increases in MDA, LDH, and SOD levels.
We next assessed the effect of nNOS inhibitors on ROS levels in N2a cells treated with PILO. The ROS level was significantly increased in the presence of PILO compared with that in the control group (n = 5, DMSO vs. PILO, P = 0.0335; Figure 5E and F), and this effect was suppressed by blocking nNOS activity with 7-NI (n = 5, PILO vs. PILO + 7-NI, P = 0.0214; Figure 5F). Moreover, a decrease in ROS generation was observed in cells incubated with the ROS inhibitor NAC (n = 5, PILO vs. PILO + NAC, P = 0.0260; Figure 5F). These data suggest that nNOS inhibition with 7-NI has a neuroprotective effect against PILO-induced increases in ROS level.
Figure 6|nNOS/ROS pathway is involved in PILO-induced apoptosis in N2a cells.

To determine the molecular mechanisms of nNOS and ROS in epileptic cell death, we monitored cellular apoptosis in the presence of 7-NI and NAC. The TUNEL assay results showed that the increased apoptosis index in PILO-treated cells was significantly reduced after treatment with 7-NI or NAC alone, and after co-treatment using the two inhibitors (Figure 6A and B). The PILO treatment group showed an increased apoptosis index compared with the untreated group (n = 3, DMSO vs. PILO, P = 0.0327), and the 7-NI and NAC treatment groups showed reduced apoptosis indexes compared with the PILO treatment group (n = 3, PILO vs. PILO + 7-NI, P = 0.0131; PILO vs. PILO + NAC, P = 0.0356). Notably, the apoptosis index of 7-NI and NAC co-treatment was decreased by approximately 20% compared with that of treatment with NAC alone, suggesting that the altered ROS level might be the downstream effect of nNOS (n = 3, PILO + 7-NI vs. PILO + 7-NI + NAC, P = 0.1226; PILO + NAC vs. PILO + 7-NI + NAC, P = 0.0387). Furthermore, caspase-3 and cytochrome c protein levels detected via western blotting confirmed the results described above. PILO upregulated the expression of caspase-3 (n = 4, DMSO vs. PILO, P = 0.0236; Figure 6C) and cytochrome c (n = 4, DMSO vs. PILO, P = 0.0051; Figure 6D). Additionally, 7-NI or NAC treatment alone reversed the aberrant expression of the two proteins (caspase-3: n = 4, PILO vs. PILO + 7-NI, P = 0.0266, PILO vs. PILO + NAC, P = 0.0233, Figure 6C; cytochrome c: n = 4, PILO vs. PILO + 7-NI, P = 0.0026, PILO vs. PILO + NAC, P = 0.0320, Figure 6D), and co-treatment with the two inhibitors exhibited a significant decrease in the caspase-3 and cytochrome c levels compared with NAC treatment alone (caspase-3: n = 4, PILO + 7-NI vs. PILO + 7-NI + NAC, P = 0.3405, PILO + NAC vs. PILO + 7-NI + NAC, P = 0.0237, Figure 6C; cytochrome c: n = 4, PILO + 7-NI vs. PILO + 7-NI + NAC, P = 0.0504, PILO + NAC vs. PILO + 7-NI + NAC, P = 0.0173, Figure 6D). Hence, these data demonstrate that the nNOS/ROS pathway is involved in PILO-induced apoptosis in N2a cells.
Figure 7|nNOS/ROS pathway is involved in PILO-induced apoptosis in N2a cells.

We performed immunostaining to determine the distribution of NLRP3, which was used as a marker of pyroptosis in cells (Tao et al., 2021). Similar to the results of our apoptosis analyses, the enhanced fluorescence intensity of NLRP3 in the PILO-treated group was significantly reversed by 7-NI, NAC, and 7-NI combined with NAC (n = 3, DMSO vs. PILO, P = 0.0022; PILO vs. PILO + 7-NI, P = 0.0174; PILO vs. PILO + NAC, P = 0.0468; PILO + 7-NI vs. PILO + 7-NI + NAC, P = 0.0133; PILO + NAC vs. PILO + 7-NI + NAC, P < 0.0001; Figure 7A and B). Expression of the pyroptosis marker GSDMD was higher in the PILO group than in the control group, and 7-NI or NAC treatment reversed this effect (n = 3, DMSO vs. PILO, P = 0.0200; PILO vs. PILO + 7-NI, P = 0.0233; PILO vs. PILO + NAC, P = 0.0298; Figure 7C). A notable reduction in GSDMD level was observed after 7-NI and NAC co-treatment compared with that after the NAC treatment alone (n = 3, PILO + 7-NI vs. PILO + 7-NI + NAC, P = 0.0545; PILO + NAC vs. PILO + 7-NI + NAC, P = 0.0090, Figure 7C). Similar results were also found with other pyroptosis markers, including IL-1β and IL-18 (IL-1β: n = 3, DMSO vs. PILO, P = 0.0489, PILO vs. PILO + 7-NI, P = 0.0488, PILO vs. PILO + NAC, P = 0.0202, PILO + 7-NI vs. PILO + 7-NI + NAC, P = 0.2905, PILO + NAC vs. PILO + 7-NI + NAC, P = 0.0246, Figure 7D; IL-18: n = 4, DMSO vs. PILO, P = 0.0422, PILO vs. PILO + 7-NI, P = 0.0314, PILO vs. PILO + NAC, P = 0.0498, PILO + 7-NI vs. PILO + 7-NI + NAC, P = 0.9711, PILO + NAC vs. PILO + 7-NI + NAC, P = 0.0270, Figure 7E). Taken together, our data indicate that the nNOS/ROS pathway is involved in PILO-induced pyroptosis in N2a cells.