脑损伤
-
Figure 1|S1P1 expression after SE and its effect on BBB integrity.
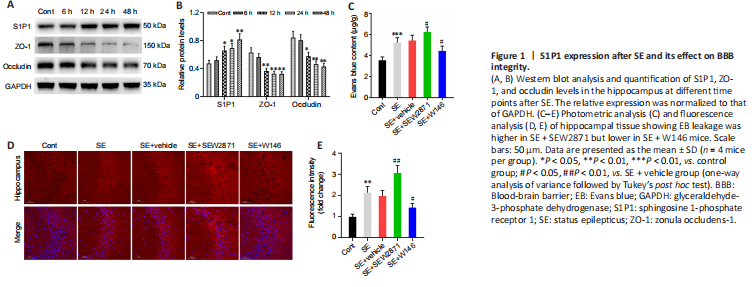
First, to explore changes in the S1P receptor family during the acute phase of SE, we detected S1P1 protein levels at various time points. Compared with controls, S1P1 expression in the hippocampus began to increase 12 hours (P < 0.05) after SE and peaked at 48 hours (P < 0.01, Figure 1A and B). However, S1P2 and S1P3 protein levels did not change after SE (Additional Figure 2A and B). We also examined TJ protein levels. ZO-1 and occludin levels gradually decreased, reaching the lowest levels at 48 hours after SE (both P < 0.01, Figure 1A and B). Thus, a time point of 48 hours after SE was used in the subsequent experiments.
As shown in Figure 1C, EB permeability in the SE group was increased compared with controls (P < 0.001). Compared with that in mice in the SE + Vehicle group, EB permeability in SE + SEW2871 group was higher (P < 0.05) while that in SE + W146 mice was lower (P < 0.05). Similarly, the results showed higher EB leakage in the SE + SEW2871 group (P < 0.01) but lower leakage in the SE + W146 (P < 0.05) group compared with that in the SE + Vehicle group (Figure 1D and E). The influence of S1P1 on TJ protein after SE was then explored using western blot. Compared with that in the SE + Vehicle group, levels of both ZO-1 and occludin in the SE + SEW2871 group were lower (both P < 0.05), while those of both in the SE + W146 group were higher (both P < 0.05; Figure 2A–C). Moreover, SEW2871 pretreatment increased seizure severity, whereas W146 pretreatment reduced seizure severity (both P < 0.01; Figure 2D) compared with that of the PTZ + vehicle group in PTZ-kindling epilepsy model mice.
Figure 3|Destruction of BBB integrity by S1P1 depends on hippocampal neuroinflammation at 48 hours after SE.
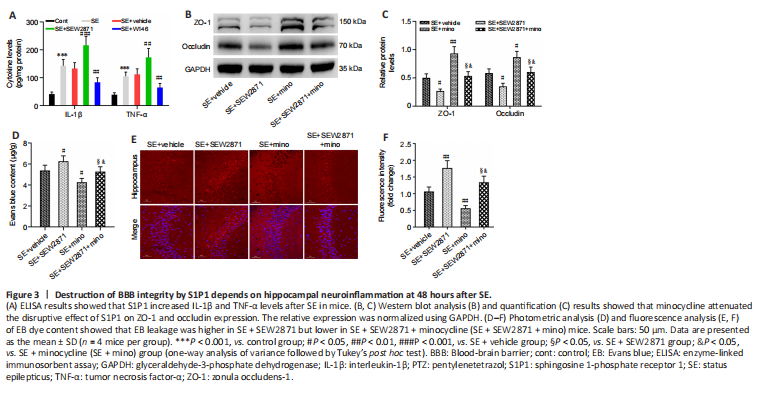
To examine whether S1P1 affects BBB integrity by regulating neuroinflammation, we first examined the effect of S1P1 on neuroinflammatory cytokines. IL-1β and TNF-α levels were markedly higher in the hippocampus after SE compared with those of controls (both P < 0.001). Furthermore, IL-1β and TNF-α levels appeared to be higher in the SE + SEW2871 group (P < 0.001 for IL-1β and P < 0.01 for TNF-α, respectively) and lower in the SE + W146 group compared with those in the SE + Vehicle group (both P < 0.01; Figure 3A). We then tested whether minocycline has an anti-inflammatory role by measuring neuroinflammatory cytokine levels in this mouse model. IL-1β (P < 0.001) and TNF-α (P < 0.01) levels decreased in the SE + minocycline group compared with those in the SE + Vehicle group. Compared with the SE + SEW2871 + minocycline group, IL-1β and TNF-α levels were increased in the SE + SEW2871 group (P < 0.01 for IL-1β and P < 0.05 for TNF-α, respectively) and decreased at SE + minocycline group (both P < 0.001; Additional Figure 3).
Subsequently, we found elevated ZO-1 and occludin levels in the hippocampus of SE + minocycline group compared with those in the SE + Vehicle group (P < 0.01 for ZO-1, P < 0.05 for occludin). ZO-1 and occludin levels were increased in the SE + SEW2871 + minocycline group compared with those in the SE + SEW2871 group (both P < 0.05), but they were decreased in the SE + SEW2871 + minocycline group compared with those in the SE + minocycline group (both P < 0.05; Figure 3B and C). Consistent with these findings, EB leakage was lower in the SE + minocycline group compared with that in the SE + Vehicle group. Furthermore, EB leakage in the SE + SEW2871 + minocycline group was lower than that in the SE + SEW2871 group but higher than that in the SE + minocycline group (all P < 0.05; Figure 3D–F).
Figure 4|S1P1 expression is increased in hippocampal astrocytes, which promote astrocyte activation after SE.
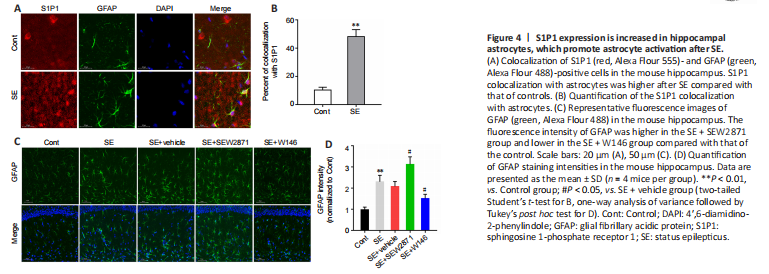
To further investigate how S1P1 regulates neuroinflammation, we performed an immunofluorescence colocalization analysis of S1P1 with astrocytes and microglia. The results indicated that co-localization of S1P1 with astrocytes was markedly higher after SE compared with that of controls (P < 0.01; Figure 4A and B), while no obvious co-localization was observed in microglia (Additional Figure 4). Compared with that in the SE + Vehicle group, the GFAP fluorescence intensity was higher in the SE + SEW2871 group and lower in the SE + W146 group (both P < 0.05; Figure 4C and D).
Figure 5|Effects of astrocyte-specific knockdown of S1P1 on tight junction proteins and BBB integrity in the hippocampus.
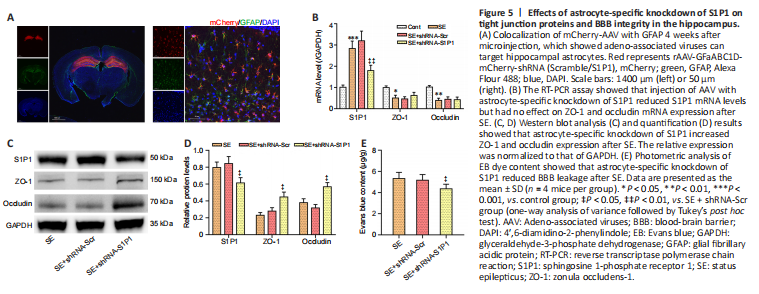
Immunofluorescence staining results showed marked viral fluorescence expressed in hippocampus and colocalized to astrocytes (Figure 5A). Confirming S1P1 knockdown, both S1P1 mRNA and protein levels were markedly decreased in the SE + shRNA-S1P1 group compared with that in the SE + shRNA-Scr group (both P < 0.05; Figure 5B–D). ZO-1 and occludin mRNA levels were not different between the two groups, although ZO-1 and occludin protein levels appeared to be elevated in the SE + shRNA-S1P1 group compared with that in the SE + shRNA-Scr group (both P < 0.05; Figure 5B–D). Additionally, EB permeability decreased in the SE + shRNA-S1P1 group compared with that in the SE + shRNA-Scr group (P < 0.05; Figure 5E).
Figure 6|Effects of astrocyte-specific knockdown of S1P1 on inflammation and seizure severity.
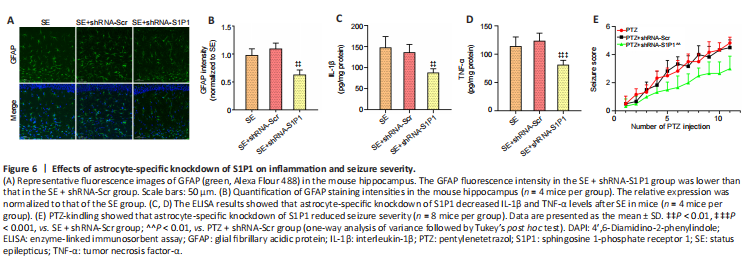
The GFAP fluorescence intensity was decreased in the SE + shRNA-S1P1 group compared with that in the SE + shRNA-Scr group (P < 0.01; Figure 6A and B). IL-1β and TNF-α levels were also lower in the SE + shRNA-S1P1 group compared with that in the SE + shRNA-Scr group (P < 0.01 for IL-1β and P < 0.001 for TNF-α, respectively; Figure 6C and D). Additionally, in the PTZ-kindling model, seizure severity was decreased in the PTZ + shRNA-S1P1 group compared with that in the PTZ + shRNA-Scr group (P < 0.01; Figure 6E).