脑损伤
-
Figure 1|Changes of cerebral blood perfusion within 30 minutes of CCI model establishment detected by laser speckle imaging.

To establish the CCI model, mice were injected intraperitoneally with 1% sodium pentobarbital (11715, Sigma, St. Louis, MO, USA) (60 mg/kg) and placed in a standard brain stereotaxic apparatus (68507, RWD Life Science Co., Ltd., Shenzhen, China). After iodine phenol disinfection, a 2 cm incision was made along the midline of the mouse scalp. Each layer of tissue was dissociated to expose the skull. A 0.5 cm diameter bone window was made with a dental drill 0.5 cm to the right and 0.5 cm posterior to the Bregma point. The strike center was 1.5 mm to the right and –1.8 mm posterior to the Bregma point in accordance with the brain atlas (Paxinos and Franklin, 2013). CCI was performed using a precision impact device (68099II, RWD Life Science Co., Ltd.; Figure 1A). Modeling was carried out following different striking parameters with a contact time of 500 ms. Care was taken to ensure the integrity of the dura mater during surgery, since the impact device uses electrical conduction to determine the plane where the dura mater is located. To avoid human error, physiological saline was used to keep the impacted area moist during the operation. To avoid the influence of the liquid surface tension caused by excessive liquid residue, the critical surface was aligned before it was hit and the target area was parallel to the plane of the hitting head. After the injury, the bleeding was stopped with gel foam and the incision was sutured. The operations were performed by a single person to avoid operator error.
The skull was exposed and placed under laser-speckle contrast imaging for 10 minutes of baseline video before the injury, and laser-speckle contrast imaging monitoring was performed for 30 minutes immediately after the injury. The laser-speckle contrast imaging system (National Laboratory for Optoelectronics, Wuhan, China) consists of an Olympus ZS61 microscope, a continuous-wavelength laser diode (k = 785 nm), a charge-coupled device camera, and a computer. The observation area was illuminated by a continuous wavelength laser light source. Speckle signals were continuously acquired by a camera (10 minutes exposure time) and then transferred to a computer for analysis. The region of interest (ROI) was selected using the computer software (SIM BFI Software, National Laboratory for Optoelectronics, Wuhan, China), and the obtained value was the average cerebral blood flow index (BFI) of the region in perfusion units (U). Three regions of interest were chosen (Figure 1B), with the cerebral blood flow before the strike as the baseline. Absolute value representations of BFI were obtained in each region of interest. The BFI was recorded in the damaged area, the same side of the damaged area, and the opposite side of the damaged area before the injury and 10, 20, and 30 minutes after CCI. The experimental process is shown in Figure 1C.
We first examined differences in cerebral surface blood flow changes in six groups of CCI model mice (1 and 2 mm at speeds of 3, 4, and 5 m/s). We performed blood flow imaging within 30 minutes after injury. Three regions were selected on the brain surface for the dynamic observation of blood perfusion. We found that there was a different trend of blood flow changes in the brain injury area between the 1 and 2 mm groups. In the 1 mm group, the cerebral blood perfusion index increased at first and then tended to flatten within 30 minutes; in the 2 mm group, the cerebral blood perfusion index showed a significant downward trend within 30 minutes (Figure 1D and E). The phenomenon was observed within the first 10 minutes (Figure 1F) and persisted until 24 hours after injury (Additional Figure 1A). To observe the changes of blood flow distribution in the whole brain after injury, we performed blood flow detection on both the ipsilateral and contralateral area of the injured brain 30 minutes after injury (Additional Figure 1B); the blood flow in these areas decreased to varying degrees after injury (Figure 1G–J). This reflects the dynamic changes of blood perfusion in the injured area and the ipsilateral and contralateral brain areas within 30 minutes after the injury. Taken together, our results suggest that the hemodynamic effects of CCI are brain-wide. This result is consistent with the decreased cerebral blood flow observed in patients with clinical TBI (Anania et al., 2021).
Figure 2| Impact of strike depth and strike speed on tissue damage.
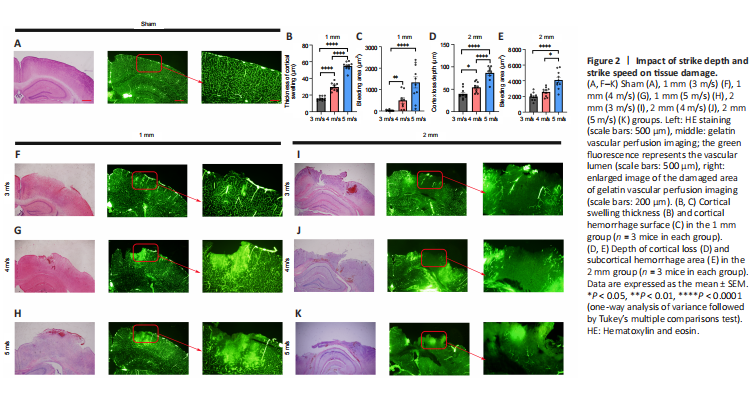
Many factors affect blood perfusion. To further examine the vascular injury under different parameters, we performed whole-brain vascular gelatin-FITC perfusion imaging immediately after injury (Figure 2A and F–K). We observed that changes in cortical blood vessels in the injured area of mice in the 1 mm group were mainly exudative in nature, and the vascular permeability was increased, resulting in leakage of gelatin. The blood vessels around the injured area were arranged in a disorderly fashion, and the brain tissue was relatively intact. In the 2 mm group, there was occlusion of blood vessels in the injured area and irregular dark areas, while the brain tissue around the injury area showed congestion and exudation.
To further examine the effect of vascular changes on the pathology of brain tissue, we performed hematoxylin and eosin staining on brain tissues within 24 hours after injury (Figure 2A, 2F–K) and evaluated the thickness of brain tissue swelling in the 1 mm group and the depth of brain tissue loss in the 2 mm group. The subcortical hemorrhage area was manually delineated and analyzed. We found that the swelling thickness of the brain tissue (Figure 2B) and the subcortical hemorrhage area in the 1 mm group increased with the increase of the injury speed (Figure 2C). Additionally, the increase in velocity led to an increase in the depth of cortical loss (Figure 2D) and the area of subcortical hemorrhage in the 2 mm group (Figure 2E). These results suggest that 1 and 2 mm strike depths cause two different damage patterns; the 1 mm striking depth led to increased blood flow in the injured area, while the 2 mm striking depth resulted in decreased blood flow in the injured area. Additionally, the effect of speed on the injury outcome varied in accordance with the different degree of the two types of injury.
Figure 3|There is a significant difference in dyskinesia between the 1 and 2 mm groups on day 7 after injury.
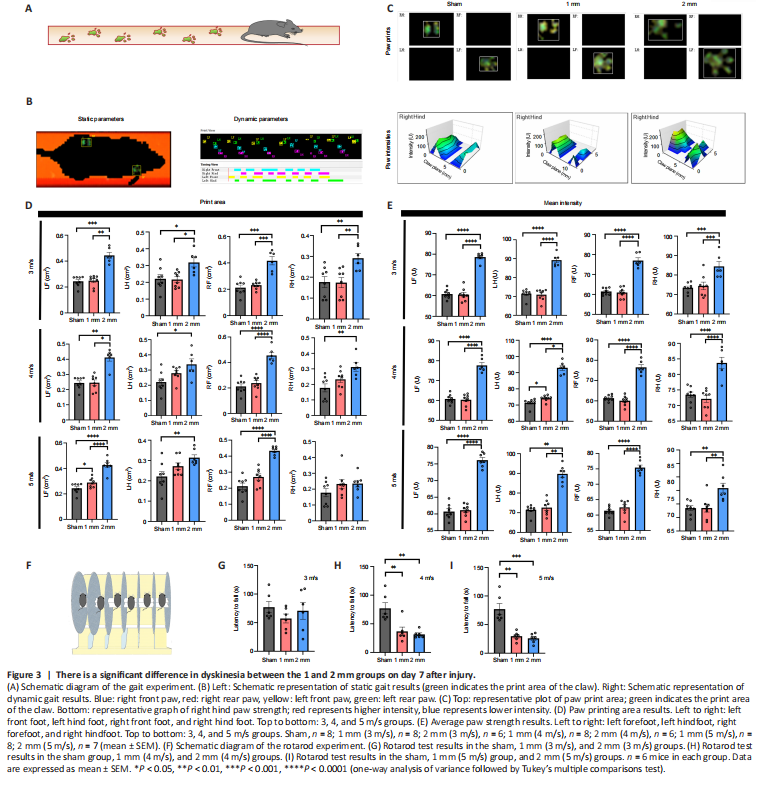
Gait analysis (Figure 3A) is an objective tool to assess motor function in CCI model mice (Walter et al., 2020). We performed gait analysis by examining static indicators such as paw print area and paw strength-related indicators and dynamic indicators such as swing speed, duty cycle, body speed, and swing (Figure 3B). We found significant differences in static parameters between the 1 mm and 2 mm groups (Figure 3C). There were also differences in body speed and other measures (Additional Figures 2–10). Therefore, we used the paw printing area and average paw strength as the main reference indicators. The results showed that the exercise ability of the limbs of the mice in the 2 mm group was affected to different degrees (Figure 3D and E). The results of the rotarod experiment (Figure 3F) indicated that the latency to fall in mice in the 1 and 2 mm groups was not significantly different from the sham group when the speed was 3 m/s (Figure 3G). However, the latency to fall in the 1 and 2 mm groups was significantly shorter than that of the sham group when the speed was 4 and 5 m/s (4 m/s: Psham-1mm= 0.0037; Psham-2mm= 0.0013; 5 m/s: Psham-1mm=0.0068; Psham-2mm= 0.0017; Figure 3H and I). However, these differences disappeared on day 30 (Figure 4A–G).
Figure 7|Electron microscopic results of mitochondria and vacuoles in the damaged area of 1 and 2 mm groups on day 7.
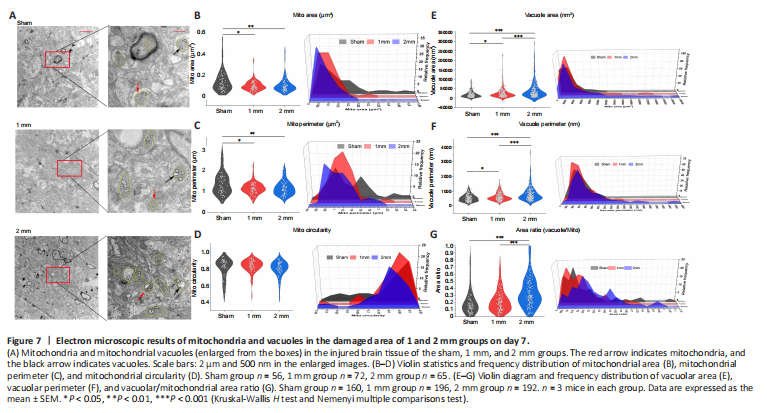
Figure 8| Electron microscopic results of mitochondria and vacuoles in the damaged area of 1 and 2 mm groups on day 30.
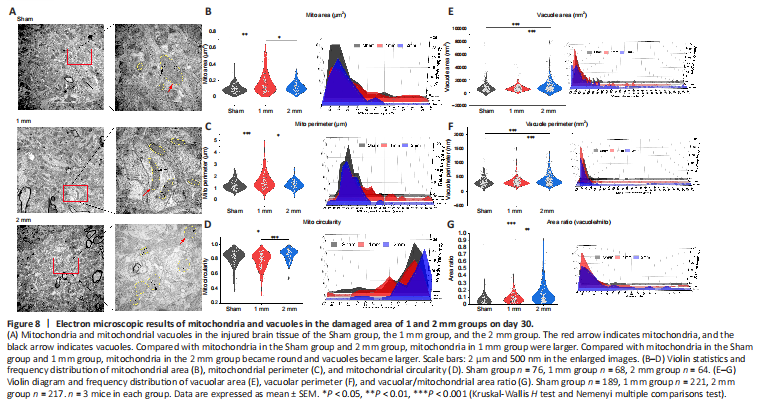
We examined brain tissue of the 1 mm and 2 mm groups on days 7 (Figure 7A) and 30 (Figure 8A) using transmission electron microscopy. We found reductions in mitochondrial area and circumference on day 7 in both the 1 and 2 mm groups (Figure 7B and C). However, the circularity of mitochondria has not changed significantly (Figure 7D). This is consistent with the changes of mitochondrial-related genes indicated by transcriptome sequencing after TBI. Additionally, the area and circumference of vacuoles inside the mitochondria in the 1 and 2 mm groups were significantly larger than those in the sham group (area: Psham-1mm = 0.032; Psham-2mm < 0.0001; circumference: Psham-1mm = 0.024; Psham-2mm < 0.0001), and the ratio of vacuole/mitochondria area in the 2 mm group increased significantly (Psham-2mm < 0.0001; Figure 7E–G), indicating that mitochondria have a large number of vacuoles. On day 30, the mitochondria in the 1 mm group were enlarged (Figure 8B and C), while the mitochondria in the 2 mm group became round (Figure 8D) and the vacuole area, circumferencethe and vacuole/mitochondria area ratio increased (Figure 8E–G). This indicated that the mitochondria in the 1 mm group showed a trend of fusion on day 30, while mitochondrial damage persisted in the 2 mm group. The mitochondrial changes in the 1 and 2 mm groups are listed in Additional Table 3.
Figure 9| Mitochondrial density and mitochondrial damage in injured brain tissue on days 7 and 30.
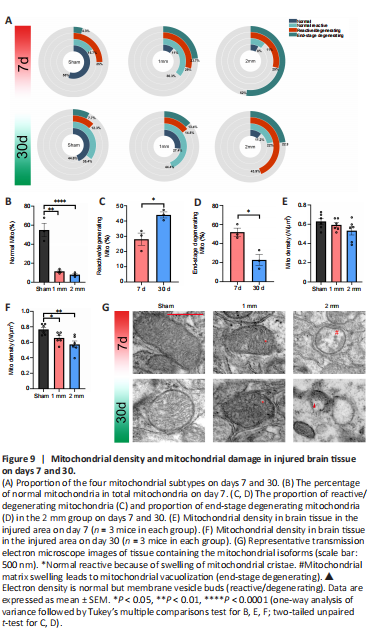
We counted the different types of mitochondria in the 1 and 2 mm groups on days 7 and 30 and their proportion relative to the total number of mitochondria (Figure 9A and G). The normal type of mitochondria in the 1 and 2 mm groups was significantly reduced on day 7 compared with numbers in the sham group (Figure 9B, Psham-1mm= 0.001; Psham-2mm< 0.0001). The 1 mm group exhibited mostly reactive and reactive degenerate mitochondria, while 52% of the total mitochondria the 2 mm group was terminal mitochondria. On day 30, the number of normal reactive mitochondria in the sham group gradually increased and the number of reactive/degenerated mitochondria decreased. The 1 mm group showed predominantly normal reactive mitochondria, while the 2 mm group showed a significant increase in reactive/degenerated mitochondria (Figure 9C, P7d–30d= 0.023) and decreased mitochondria at the end stage (Figure 9D, P7d–30d= 0.015).
The main reason for different mitochondrial microstructure changes in the 1 and 2 mm groups was that the damage of normal reactive mitochondria belonged to the mitochondrial cristae swelling (Additional Figure 15A) and was reversible while the damage to the mitochondrial matrix vacuolation (Additional Figure 15B) that occurs in reactive/degenerating mitochondria was irreversible (Khmelinskii and Makarov, 2022). This may also be the reason for the difference in mitochondrial density between the 1 and 2 mm groups (Figure 9E and F). There was no significant difference in mitochondrial density between the sham, 1 mm, and 2 mm groups on day 7. After 30 days, many reactive/degenerated mitochondria and terminal mitochondria in the 2 mm group were dying, which led to a decrease in mitochondrial density in the 2 mm group; this may also be the reason for the decrease in the mitochondrial density in the 1 mm group. These findings suggest that differences in the dynamic changes of mitochondria may contribute to the difference in injury damage patterns between the 1 and 2 mm groups.