脑损伤
-
Figure 1|Effect of HI on EAAT2 expression in the hippocampal region in pigs.
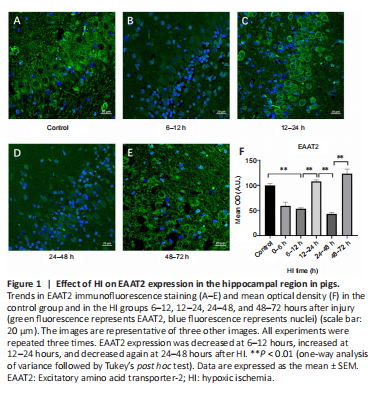
Figure 2| The effect of HI on vGLUT1 expression in the hippocampal region in pigs.
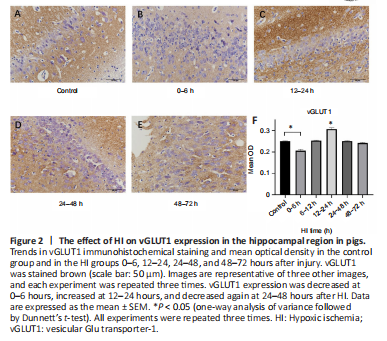
To investigate changes in Glu transport after HI, we first analyzed changes of EAAT2, vGLUT1 expression and Glu content. The trends in EAAT2 expression after HI is shown in Figure 1. Compared with the control group, EAAT2 expression was decreased at 6–12 hours (P < 0.001), increased at 12–24 hours (P < 0.001), decreased at 24–48 hours, and increased again at 48–72 hours (P < 0.001) after HI. vGLUT1 expression (Figure 2) was decreased at 0–6 hours after HI (P = 0.042), then increased, peaking at 12–24 hours after HI (P < 0.05), and decreased again at 24–48 hours (P = 0.011). Compared with the control group (5.398 ± 0.476 mM), Glu levels as measured by 1H-MRS were significantly higher 24–48 hours after HI (10.850 ± 2.192 mM; P = 0.019).
Figure 3| Effect of HI on synaptophysin expression and synaptic transmission electron microscopy images in the hippocampal region in pigs.
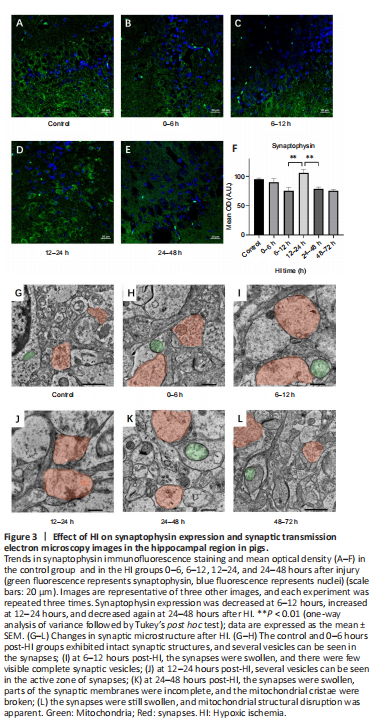
To investigate changes in synaptic protein expression and synaptic microstructure, we next analyzed synaptophysin expression after HI injury (Figure 3A–L). Compared with that observed at 6–12 hours (Figure 3C) after HI, synaptophysin expression was transiently increased at 12–24 hours (Figure 3D) after HI (P = 0.003). Moreover, TEM showed an increase in the number of intrasynaptic vesicles at this time point (Figure 3J). In addition, synaptophysin expression was decreased significantly at 24–48 hours (Figure 3E) after HI (P = 0.009), at which time TEM showed disruption of synaptic structures (Figure 3K) and a decrease in the number of intrasynaptic vesicles.
Figure 4|Effects of HI on Notch1 and Jagged1 expression and Notch1/Jagged1 double-positive immunofluorescence in the hippocampal region in pigs after HI.
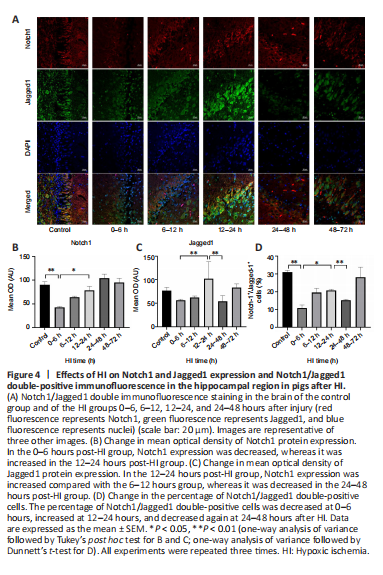
Figure 5|Changes in NICD expression in the hippocampal region in pigs after HI.
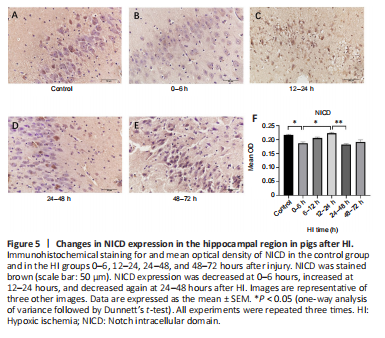
To investigate changes in Notch signaling pathway, we analyzed Notch1, Jagged1, and NICD expression after HI injury. The changes in Notch1 and Jagged1 expression and in the percentage of Notch1/Jagged1 double-positive cells after HI injury are shown in Figure 4. Notch1 expression (P = 0.001) and the percentage of Notch1/Jagged1 double-positive cells (P = 0.002) were decreased at 0–6 hours compared with the control group. Notch1 (P = 0.014) and Jagged1 (P = 0.009) expression and the percentage of double-positive cells (P = 0.048) were increased at 12–24 hours. The trends in NICD expression after HI injury over time are shown in Figure 5. NICD expression was significantly higher at 12–24 hours than it was at 0–6 hours and 24–48 hours after HI (P = 0.026 and P = 0.001, respectively).