颅神经损伤
-
Figure 2 Endothelin-1 (ET-1) is produced by olfactory mucosa primary culture cells until confluence.
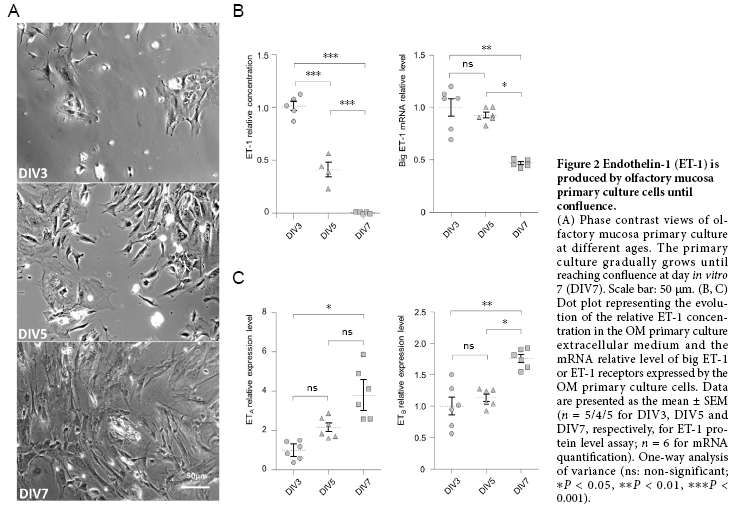
In order to characterize the level of local ET-1 production by the OM primary culture cells, we measured the presence of ET-1 in the medium of culture at DIV3, DIV5 and DIV7 directly by EIA (Figure 2A). ET-1 was not present in the primary culture medium without cells (0.03 ± 0.1 pg/mL, i.e., 0.012 pM; n = 4), but was present at DIV3 (36.9 ± 3.4 pg/mL, i.e., 14.8 pM; n = 5) and DIV5 (37.1 ± 3.1 pg/mL, i.e., 14.9 pM; n = 4). However at DIV7, ET-1 was no longer detectable (0.2 ± 0.5 pg/mL; n = 5). We normalized the level of ET-1 in the medium relative to the cellular density estimated from LDH content to express the production of ET-1 relative to the cellular density (Figure 2B). One-way ANOVA followed by Bonferroni multiple comparison test showed that the ET-1 production significantly decreased from DIV3 to DIV7 (P < 0.001). This was consistent with RT-qPCR analysis showing that big-ET1 expression similarly decreased from DIV3 to DIV7 (Figure 2B; P = 0.003). By contrast, the expression of ETA and ETB receptors increased gradually with culture age (Figure 2C; P = 0.017 and 0.003, respectively).
Figure 3 Calcium imaging responses to endothelin-1 (ET-1) stimulation of the olfactory mucosa primary culture.

Primary culture of OM cells are strongly desensitized after ET-1 stimulation (Gouadon et al., 2010). If ET-1 was secreted in the culture medium by OM cells, then they should not be responsive to ET-1 stimulation until ET-1 level decreases. We recorded from DIV1 to DIV8 the response of the OM primary culture cells to exogenous stimulation by ET-1 (10–7 M) and ATP (10–4 M) used as a positive control. While some OM cells were already sensitive to ATP at DIV1, they were not responsive to ET-1 before DIV6 and the largest differences between these two agonists were observed at DIV5 (Figure 3A and B). Two-way ANOVA analysis revealed significant differences between the percentage of cells responding according to the age of the culture (F(7,43) = 45.74, P < 0.001). The percentage of cells responding between ATP and ET-1 were also significantly different (F(7,43) = 11.46, P < 0.001) especially at DIV5 and DIV6 (Bonferroni multiple comparison post-hoc tests, P < 0.01). While the percentage of responding cells clearly varied according to the culture ages, no obvious effect of treatment was observed for the intensity of the calcium rise in the sensitive cells following ATP or ET-1 stimulation (Figure 3C). Globally, the calcium response intensity increased with culture age which is consistent with the increasing degree of differentiation and maturity of the OM primary culture cells.
Figure 4 Impact of 1 week of endothelin receptor antagonists (mixture of BQ123 and BQ788) instillation on the olfactory mucosa.
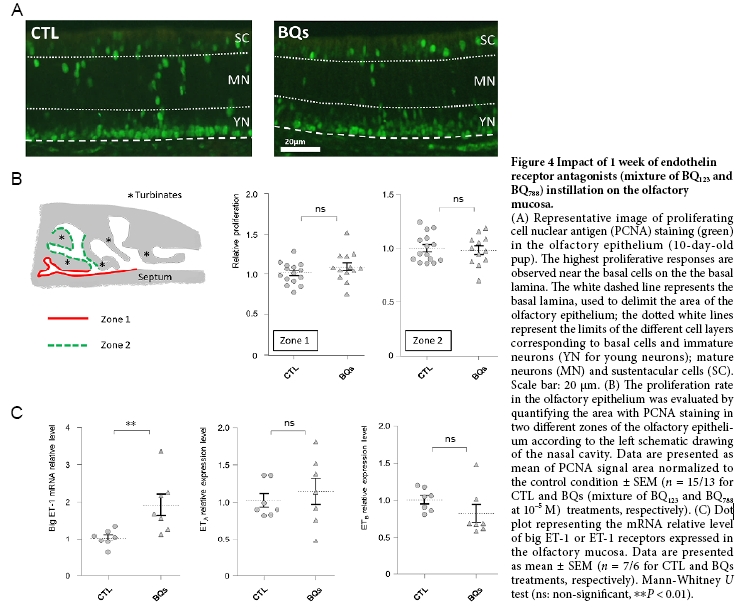
To evaluate the potential proliferative role of ET-1 in vivo, we next treated 3-day-old rat pups with intranasal instillations of BQs at 10–5 M during 1 week. We then evaluate the proliferation level by immunohistochemistry against PCNA, a marker of dividing cells (Ohta and Ichimura, 2000). We focused on two different zones of the olfactory epithelium based on a recent study showing that nasal instillation was differentially effective according to the OM localization (Hasegawa-Ishii et al., 2017). This epithelium can be divided in three sub-areas with the lowest one containing basal cells and young neurons (Moon et al., 2009). As expected, we observed a staining mainly above the lamina propria (Figure 4A). However, the percentage of PCNA stained area in the olfactory epithelium was not significantly modified by a treatment with a saline solution or the mixture of ET receptors antagonists in both zones evaluated (Figure 4B; Mann-Whitney U test; P = 0.317 and 0.903 for zones 1 and 2, respectively). Wondering if our treatment could impact the local production of ET-1, we measured by RT-qPCR the expression of big ET-1 and ET receptors in these conditions. Big ET-1 mRNA was indeed increased after the BQs treatment (Figure 4C; Mann-Whitney U test; P = 0.004).
Figure 5 Impact of 1 day of endothelin receptor antagonist (mixture of BQ123 and BQ788) instillation on the olfactory mucosa.

Expression of ET receptors was not significantly altered despite a slight tendency for a decrease in the expression of ETB in BQ-treated animals (Mann-Whitney U test; P = 0.522 and 0.072 for ETA and ETB, respectively). This result would indicate that the ET system in the OM adapted unexpectedly fast to the BQs treatment, so we next examined the impact of a 24-hour treatment with BQs on 9-day-old rat pups, which were euthanized at the same age as the previous group, i.e., at 10-day-old (Figure 5A). With this shorter treatment duration, we observed that the proliferation rate was decreased by the BQs treatment in the OM in both zones evaluated (Figure 5B; Mann-Whitney U test; P = 0.004 and 0.017 for zones 1 and 2, respectively).