脊髓损伤
-
Figure 5|HE-stained sagittal sections 7 and 70 days after spinal cord injury at the C6 level.
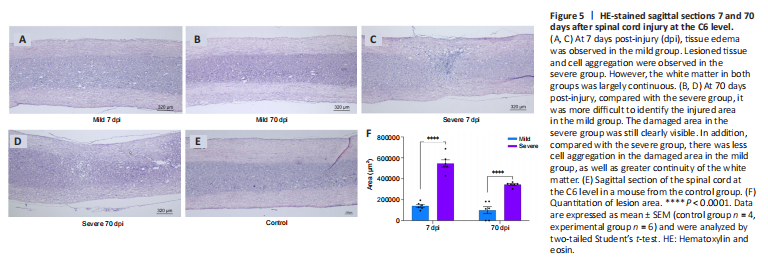
Morphologically, our analysis of histological sections suggested that tissue damage in the cervical SCI model, whether induced by mild or severe injury, is mainly concentrated in the gray matter around the central spinal cord. Of all of the tissue samples examined, only one showed a cavity at the lesion center. The mild group exhibited relatively inconspicuous gray matter loss and disordered cell arrangement. In the severe group, severe necrosis and scar formation appeared at the lesion center. Lesion severity and preservation of spared tissue were also evaluated quantitatively by hematoxylin and eosin staining of coronal and sagittal sections. The quantitative results showed that the injured area in the mild group was smaller than that in the severe group at 7 (t = 10.72, P < 0.0001) and 70 days post-injury (t = 7.036, P < 0.0001). No significant difference in the area of spared white matter was found among the control, mild, and severe groups (P > 0.05). As for intact gray matter area, there was no significant difference between the mild group and the control group (P > 0.05), and the severe group exhibited less gray matter area than the control group (t = 4.831, P < 0.01). The mild group exhibited a larger area of gray matter than the severe group (t = 4.444, P < 0.01). These findings show that the injury induced significant damage mainly to the gray matter, while the white matter remained largely unaffected. Additionally, compared with the mild group, the total area of damaged tissue in the severe group significantly increased (t = 8.553, P < 0.0001; Figures 4 and 5).
Figure 6|Comparison of immunofluorescence results in each group after cervical spinal cord injury.
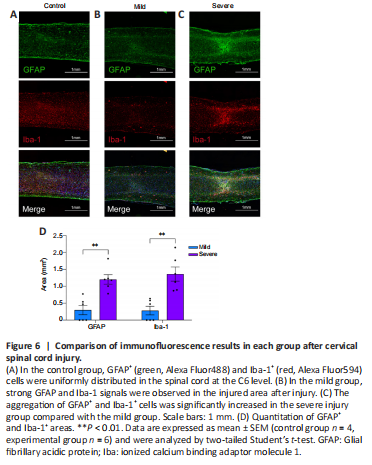
Figure 7|Representative NF-200 immunofluorescence images at 28 days post-injury.
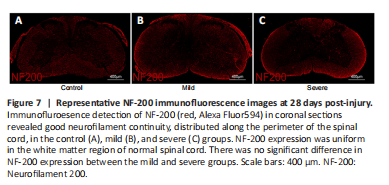
Immunofluorescence staining showed that GFAP, a marker for astrocytes, formed a clear boundary around lesions composed of Iba-1+ microglia. Sagittal sections stained for GFAP showed massive areas of astrocyte aggregation in both the mild and severe groups (t = 4.579, P < 0.01). Iba-1 staining showed areas of microglial activation in both the mild and severe groups (t = 4.424, P < 0.01). In addition, we found that GFAP+ and Iba-1+ cell aggregation increased with greater degree of injury, indicating more glial scarring and a stronger inflammatory reaction (mainly mediated by nervous system microglia) in the severely injured areas. The glial scar and clear inflammatory response were mainly observed in the spinal cord gray matter, and rarely affected the continuity of the white matter, which was consistent with the hematoxylin-eosin staining results. Coronal NF-200 staining showed areas of good neurofilament continuity distributed along the perimeter of the spinal cord in the control, mild, and severe groups. No statistical significance in the size of the NF-200-positive area was observed among the control group (47.279 ± 1.585%, n = 4), mild group (43.310 ± 3.008%, n = 6), and severe group (48.276 ± 2.503%, n = 6) (P > 0.05). NF-200 staining further verified that the damage caused by CCS was mainly restricted to the gray matter, with relatively slight or no damage seen in the white matter (Figures 6 and 7).
Figure 8|Prussian blue staining results 7 days after cervical spinal cord injury.

Next, we performed Prussian blue staining to detect hemosiderosis, which is iron precipitation in tissue (Lu et al., 2020). The results showed that, on the 7th day after injury, there was no significant change in the mild group compared with the normal group, while the severe group showed significant blue precipitation at the lesion center (Figure 8).