神经退行性病
-
Figure 1|Analysis of HexA overexpression in genetically modified hMSCs-HEXA-HEXB.
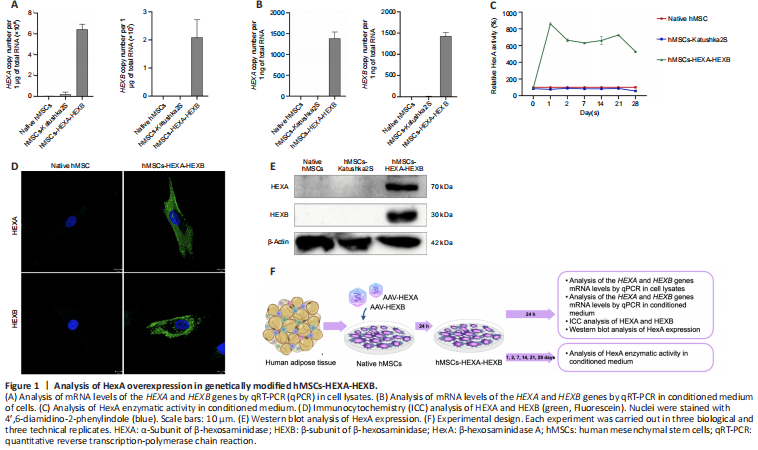
hMSCs were isolated from adipose tissue and genetically modified using recombinant AAV-HEXA and AAV-HEXB (hMSCs-HEXA-HEXB) encoding codon-optimized nucleotide sequences of the HEXA and HEXB cDNA genes (nucleotide sequences and their description were published in our previous article (Shaimardanova et al., 2022; Figure 1F). AAV-Katushka2S encoding the far-red fluorescent protein Katushka2S gene was used as a control of genetic modification (hMSCs-Katushka2S). The number of transduced hMSCs-Katushka2S after viral infection was 93.5% which was measured by flow cytometry (Additional Figure 1). hMSCs-HEXA-HEXB were found to contain 6,430,894.5 ± 490,866.57 and 2,093,724.3 ± 6,273,152 copies of the HEXA and HEXB gene mRNA, respectively, per 1 μg of total RNA (Figure 1A). CM harvested from hMSCs-HEXA-HEXB was found to contain 1383.49 ± 157.9 and 1429.91 ± 81.99 copies of the HEXA and HEXB gene mRNA, respectively, per 1 ng of total RNA (Figure 1B). The presence of HEXA (70 kDa) and HEXB (30 kDa) proteins in hMSCs-HEXA-HEXB was confirmed by WB (Figure 1E) and ICC (Figure 1D). An increase in HexA enzymatic activity by 5.3–8.6 times was observed in hMSCs-HEXA-HEXB CM, compared with CM from native hMSCs and hMSCs-Katushka2S (Figure 1C).
Figure 2|Restoration of HexA level in mutMSCs after cultivation with hMSCs-HEXA-HEXB in the Transwell system.

hMSCs-HEXA-HEXB were co-cultured with mutMSCs in the Transwell culture system (Figure 2D). The patient’s mutation in the HEXA gene was described in our previous work (Shaimardanova et al., 2021). After HexA delivery by cross-correction in the Transwell system, mutMSCs were found to contain 72,903.121 ± 14,026.652 and 80,899.701 ± 20,847.923 copies of the HEXA and HEXB gene mRNA, respectively, per 1 μg of total RNA (Figure 2A). HEXA concentration in cell lysates was determined by ELISA. HEXA concentration in mutMSCs after cross-correction was increased by 2.25 times compared with the native mutMSCs (Figure 2B). ICC analysis has confirmed the presence of HEXA and HEXB proteins in mutMSCs after cross-correction (Figure 2C). To analyze changes in the amount of GM2 gangliosides in mutant MSCs after co-cultivation with MSCs-HEXA-HEXB in the Transwell system mass spectrometry was also carried out. However, no statistically significant difference in GM2 ganglioside level was found.
Figure 5|Determination of HexA expression levels in various organs of rats 24 and 48 hours following intravenous administration of rMSCs-HEXA-HEXB.
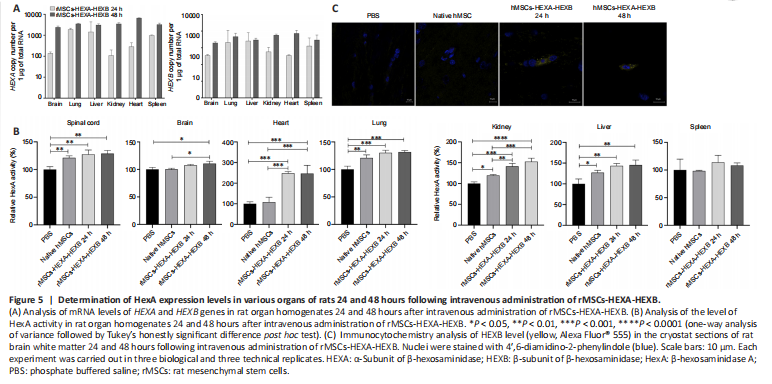
Levels of HEXA and HEXB gene mRNA in the homogenates of rat organs were analyzed by qPCR 24 and 48 hours after intravenous administration of rMSCs-HEXA-HEXB. 24 and 48 hours after administration of rMSCs-HEXA-HEXB, codon-optimized HEXA, and HEXB gene mRNA copies were detected in the brain, lung, liver, kidney, heart, and spleen of rats (Figure 5A).
HexA enzymatic activity was analyzed in rat organ homogenates 24 and 48 hours after cell administration. In spinal cord homogenates, HexA enzymatic activity was significantly increased by 27.4% (P < 0.01) and 28.76% (P < 0.01) after 24 and 48 hours, respectively, in comparison with the control group. No statistically significant difference was observed in comparison with the native rMSCs group. In brain homogenates, a statistically significant increase in HexA enzymatic activity by 10.7% (P < 0.05) and 10.6% (P < 0.05) compared with the control and native rMSCs groups, respectively, was found only after 48 hours. In heart homogenates, HexA enzymatic activity was significantly increased by 148.16% (P < 0.001) compared with the control group and by 139.78% (P < 0.001) compared with the native rMSCs group after 24 hours, as well as by 147.32% (P < 0.001) compared with the control group and by 138.95% (P < 0.001) compared with the native rMSCs group after 48 hours. In lung homogenates, a statistically significant increase in HexA enzymatic activity by 30.31% (P < 0.001) and 31.72% (P < 0.001) after 24 and 48 hours, respectively, was found compared only with the control group. There was also a statistically significant increase of the HexA activity by 20.76% (P < 0.01) in the native rMSCs group compared with the control group. In kidney homogenates, HexA enzymatic activity was significantly increased by 41.22% (P < 0.001) in comparison with the control group and by 21.57% (P < 0.01) in comparison with the native rMSCs group after 24 hours; as well as by 52.6% (P < 0.0001) compared with the control group and by 32.96% (P < 0.001) compared with the native rMSCs group after 48 hours. In liver homogenates, a statistically significant increase in HexA enzymatic activity by 43.35% (P < 0.01) and 45.35% (P < 0.01) was found after 24 and 48 hours, respectively, compared only with the control group. HexA activity was also significantly increased by 27.07% (P < 0.05) in the native rMSCs group, compared with the control group. In spleen homogenates, no statistically significant difference in HexA enzymatic activity was observed between groups (Figure 5B). At 24 and 48 hours after rMSCs-HEXA-HEXB injection, single cells overexpressing HEXB protein were detected in rat brain sections by ICC (Figure 5C).
Figure 6| Intravenous administration of rMSCs-HEXA-HEXB dose not affect the studied safety parameters in rats 24 and 48 hours following intravenous administration.
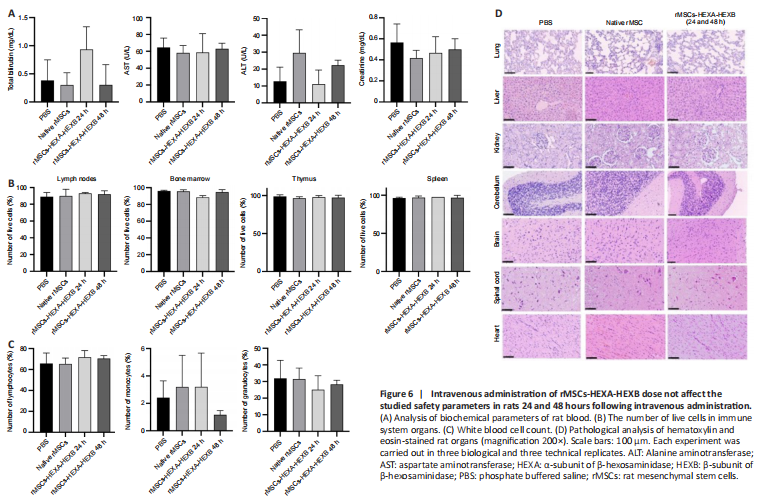
Analyses of blood biochemical parameters (levels of total bilirubin, AST, ALT, and creatinine) (Figure 6A), number of live cells in immune system organs (Figure 6B), white blood cell count (Figure 6C), and the profile of inflammatory cytokines in rat blood plasma (Table 2) showed no statistically significant difference between experimental and control groups. Histopathological analysis of lung tissue in both control and experimental groups showed thickening of the interstitium and interalveolar septa. In single samples of liver tissue in each group, local small fat droplet degeneration was noted. However, no significant difference was found between the control and experimental groups. No obvious pathological changes were observed in the other organs of experimental animals compared with the control group (Figure 6D).