脊髓损伤
-
Figure 1|LD accumulation in perilesional neurons after SCI.
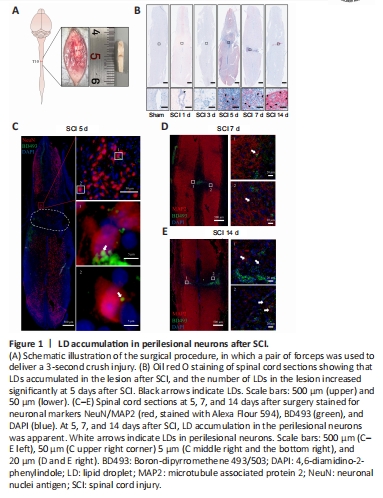
SCI was induced by clamping the T10 segment of the mouse spinal cord with forceps for 3 seconds (Li et al., 2022; Figure 1A and Additional Figure 2). Oil red O staining showed significant accumulation of LDs in the lesion at 5, 7, and 14 days after SCI (Figure 1B). To determine whether the LDs accumulated in neurons, we performed immunofluorescence staining. NeuN (Girdhar et al., 2018) and MAP2 (Martinez-Vicente et al., 2010) were used as neuronal markers. Colocalization of NeuN or MAP2 with BD493 indicated that LDs accumulated in perilesional neurons after SCI (Figure 1C–E).
Figure 2| LD accumulates in MD-treated HT22 cells.

To investigate whether MD can induce LD accumulation in neurons, we treated HT22 cells with 500 μg/mL MD for 24 hours. LDs were labeled with BD493 and detected by flow cytometry. The results showed that the mean fluorescence intensity of fluorescein isothiocyanate in the MD group was increased significantly compared to the Control group, suggesting that excess LDs were generated (Figure 2A and B). Confocal fluorescence microscopy also showed that many LDs were present in HT22 cells in the MD group, while almost no LDs were present in HT22 cells in the Control group (Figure 2C). To verify that LD accumulation was caused by MD phagocytosis, we labeled MD with CFSE, treated HT22 cells with CFSE-MD, and performed live cell imaging. The results showed that MD was phagocytosed by HT22 cells and transferred to lysosomes, which were labeled using a Lyso-Tacker Red probe (Figure 2D).
To further investigate the changes in HT22 cells after MD treatment, RNA-seq was performed. PCA indicated that there were differences at the transcriptome level between the Control and MD groups (Figure 2E). Difference analysis showed that 79 genes were upregulated and 62 genes were downregulated in the MD group compared with the Control group (Figure 2F and Additional Figure 3A). Importantly, Lipg (which encodes lipase G) was one of the significantly upregulated genes. Lipg is a member of the triglyceride lipase family (Gago-Dominguez et al., 2021). Compared with other triglyceride lipases, Lipg mainly shows phospholipase activity (Lo et al., 2020). Therefore, the RNA-seq results suggested that phospholipid-rich MD was phagocytosed and degraded by HT22 cells.
Figure 3|MD degradation leads to excessive FFA generation and greater β-oxidation in HT22 cells.
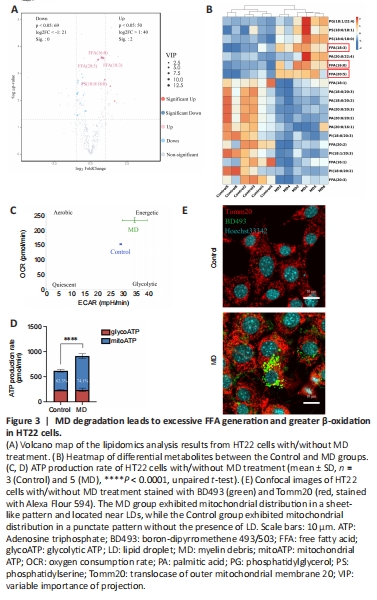
When MD phospholipids are degraded by phospholipases, FFAs are released into the cytoplasm (Kopper et al., 2021). We performed untargeted lipidomics to determine lipid composition and levels in the Control and MD groups. The PCA and OPLS-DA results demonstrated a clear distinction between the Control and MD groups (Additional Figure 3B–D). On the basis of the OPLS-DA model, we predicted the VIP value of each metabolite. The Volcano plot and heatmap results indicated that there were significantly more metabolites with high VIP values in the MD group compared with the Control group, and most of these metabolites were FFAs, such as FFA (16:0), FFA (20:5), and FFA (18:3). Most of the downregulated lipids were phospholipids (Figure 3A and B). These results are consistent with our hypothesis that MD degradation by phospholipases in HT22 cells generates large amounts of FFAs.
Excess FFAs are stored in LDs to avoid lipotoxicity (Li et al., 2020); however, whether some FFAs are transported into mitochondria and β-oxidated remains unclear. We analyzed the level of carnitine palmitoyltransferase 1a (Cpt1a), a key protein that controls the entry of long-chain FFAs into mitochondria (Peng et al., 2022). The level of Cpt1a in the MD group increased significantly, which indicated that more long-chain FFAs might enter mitochondria for β-oxidation in the presence of MD than when MD is not present (Additional Figure 3E). A large amount of nicotinamide adenine dinucleotide (NADH) and flavine adenine dinucleotide, reduced (FADH2) are produced in the β-oxidation process. Acetyl-coenzyme A, the end product of β-oxidation, can enter the tricarboxylic acid cycle, thus producing more NADH and FADH2. Eventually, the NADH and FADH2 are used for oxidative phosphorylation to produce ATP (Raud et al., 2018). We performed an Agilent Seahorse XF real-time ATP production rate assay to assess HT22 metabolism after MD treatment. The results showed that the oxidative phosphorylation level of HT22 cells was enhanced after MD treatment; however, the glycolysis level was not significantly changed (Figure 3C and D). Research has shown that the mitochondrial network must be extensively fused for efficient β-oxidation (Rambold et al., 2015; Ioannou et al., 2019). Therefore, translocase of outer mitochondrial membrane 20 (Tomm20) was used to label the mitochondria. The fluorescence confocal imaging results showed that the mitochondria in the MD-treated HT22 cells were extensively fused, and the LDs were in close proximity to the mitochondria, while in the Control group the mitochondria were fragmented, and no LDs were apparent (Figure 3E). In conclusion, MD was phagocytosed and degraded by HT22 cells, leading to increased LD and β-oxidation levels.
Figure 4|MD induces HT22 cell damage by promoting lipid peroxidation.
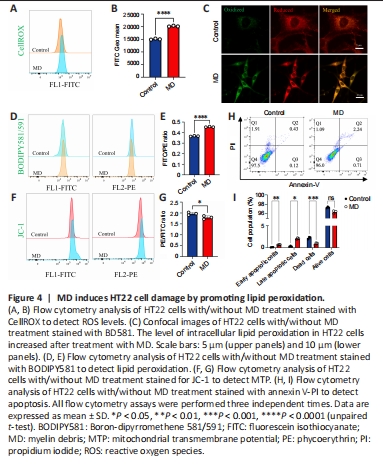
The level of oxidative phosphorylation in MD-treated HT22 cells increased; therefore, we speculated that the production of ROS, a by-product of oxidative phosphorylation, would also increase, thus causing oxidative damage to cells (Sch?nfeld and Reiser, 2017). To examine this, ROS levels in HT22 cells were detected using the CellROXTM Green probe. The results showed that ROS levels in HT22 cells were significantly increased after MD treatment (Figure 4A and B). Excessive ROS were produced, and the lipidomics results suggested that many polyunsaturated fatty acids were also produced after MD treatment; therefore, we speculated that ROS would oxidize these polyunsaturated fatty acids and cause lipid peroxidation. We measured lipid peroxidation in HT22 cells using BD581, a ratiometric lipid peroxidation sensor (Yu et al., 2020). We observed an increase in the BD581 ratio in HT22 cells treated with MD, which indicated higher lipid peroxidation in the MD group (Figure 4C–E).
Lipid peroxidation can cause lipotoxic damage to cells (Papsdorf and Brunet, 2019); therefore, we examined the level of HT22 cell apoptosis. In normal cells, the mitochondrial transmembrane potential (MTP) is normal. We observed a decrease in the JC-1 ratio in HT22 cells treated with MD, which indicated a lower MTP in the MD group (Figure 4F and G). To confirm the increased in apoptosis, we examined MD-treated HT22 cells using AnnexinV-PI flow cytometry. The results showed that apoptosis was increased to a certain extent in the MD group (Figure 4H and I).
Figure 5|High-content screening assay for lipid-lowering compounds.
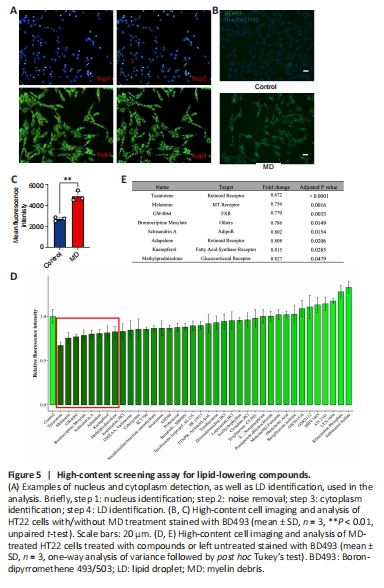
As lipitoxicity causes neural cell death, we next sought to identify a compound to lower lipid levels in MD-treated HT22 cells. To identify lipid-lowering compounds, we used a high-content cell imaging analysis system. We first analyzed MD-treated HT22 cells to ensure the reliability of LD detection by the system. We found that the system could sensitively capture cell information in each well of the 96-well plate. After removing signal noise, the nucleus was selected through the 350-nm channel, and the cytoplasm was selected through the 488-nm channel, to delineate a region of interest. Bright circular spots in the 488-nm channel in the region of interest defined as LDs. The number, size, area, and fluorescence intensity of the LDs were recorded, analyzed, and normalized to the number of cells in each well (Figure 5A). The average green fluorescence intensity of each well was calculated and considered to reflect the average LD content. The results showed that the system also accurately and sensitively captured the significant increase in LDs in MD-treated HT22 cells (Figure 5B and C).
Based on the above methods and literature review, 38 compounds from the L2600 Compound Library were added to HT22 cells 6 hours before the end of MD treatment, to a final concentration of 10 μM, based on the literature (Dieb et al., 2014; Liu et al., 2016). We identified eight compounds that appeared to lower lipid levels in the MD-treated HT22 cells (Figure 5D and E and Additional Figure 4). Among them was one compound, BRO, that is able to cross the blood-brain barrier (Papsdorf and Brunet, 2019); BRO was thus selected for further investigation.
Figure 6|500 nM BRO protects MD-treated HT22 cells from lipotoxicity by alleviating LD accumulation.
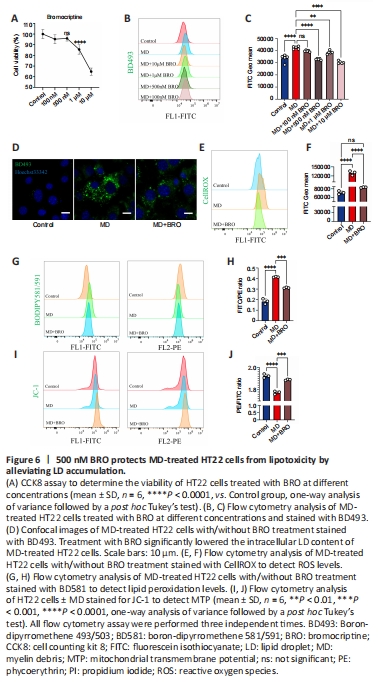
To determine the optimal dose of BRO, we explored the cytotoxicity and lipid-lowering effects of different concentrations of BRO. CCK8 assay showed that treatment of HT22 cells with 10 μM or 1 μM of BRO for 24 hours significantly reduced cells viability, while there was no significant toxicity at 500 nM or 100 nM (Figure 6A). Importantly, 1 μM, 10 μM, and 500 nM BRO significantly lowered LD levels in MD-treated HT22 cells, whereas 100 nM BRO had no lipid-lowering effect (Figure 6B and C). These results were confirmed by confocal imaging (Figure 6D). Therefore, we selected 500 nM BRO for use in subsequent experiments.
After treating MD-treated HT22 cells with 500 nM BRO for 24 hours, flow cytometry was used to detect ROS and lipid peroxidation. The results showed that 500 nM BRO treatment significantly reduced ROS levels and the lipid peroxidation ratio in MD-treated HT22 cells (Figure 6E–H). Furthermore, treatment with 500 nM BRO alleviated the decrease in MTP and the increase in apoptosis seen in MD-treated HT22 cells (Figure 6I, J and Additional Figure 5A and B).
Figure 8|BRO inhibits MD degradation, thereby reducing FFA generation and β-oxidation in HT22 cells.
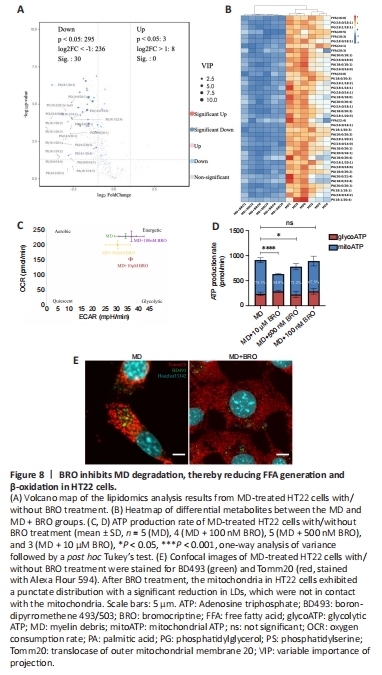
The PCA and OPLS-DA results from the untargeted lipidomics analysis showed a clear distinction between the MD and MD + BRO groups (Additional Figure 7A–C). A volcano plot and heatmap demonstrated that the concentrations of key metabolites decreased significantly in the MD + BRO group, including a large number of FFAs, such as FFA (16:0), FFA (20:5), and FFA (18:3) (Figure 8A and B).
Cpt1a expression in the MD + BRO group decreased significantly (Additional Figure 7D). Oxidative phosphorylation was also inhibited in HT22 cells after treatment with 10 μM or 500 nM BRO, with no significant change in glycolysis. Treatment with 100 nM BRO had no effect on oxidative phosphorylation or glycolysis in HT22 cells (Figure 8C and D). Fluorescence confocal imaging showed that the mitochondria in the MD + BRO group were highly fragmented and not in contact with LD (Figure 8E).
Figure 9| BRO promotes locomotor recovery in SCI mice by alleviating LD accumulation in perilesional neurons.
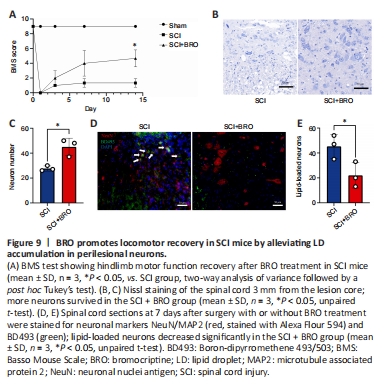
To examine the therapeutic effect of BRO in vivo, mice received daily injections of 8 mg/kg BRO intraperitoneally after SCI (Framnes-DeBoer et al., 2020). The results showed that the BMS scores of the SCI + BRO group improved significantly on day 14 after SCI (Figure 9A). Nissl staining showed that a higher number of perilesional neurons survived in the SCI + BRO group on day 7 after SCI (Figure 9B and C). Immunofluorescence staining was also performed, and the results showed that the number of lipid-loaded neurons around the lesion decreased significantly in the SCI + BRO group (Figure 9D and E). Therefore, BRO promoted locomotor recovery after SCI in mice by alleviating LD accumulation in neurons.