脑损伤
-
Figure 1|Mitochondrial transfer occurs in brain microvascular endothelial cells mainly in the form of TNTs.
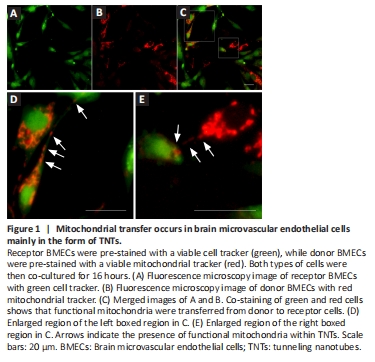
To assess whether functional mitochondria can transfer between BMECs, receptor BMECs were labeled with a green cell tracker (Figure 1A), while donor BMECs were labeled with a red mitochondrial tracker (Figure 1B). These two types of cells were then co-cultured for 16 hours. We found that red mitochondria from donor BMECs were present in receptor BMECs, as shown by co-staining of green and red fluorescent BMECs (Figure 1C). In addition, we observed TNT structures between BMECs and the presence of functional mitochondria in TNTs (Figure 1D and E). This suggests that TNTs may enable mitochondrial transfer between BMECs.
Figure 2|High glucose levels decrease mitochondrial transfer and increase mitochondrial superoxide production.
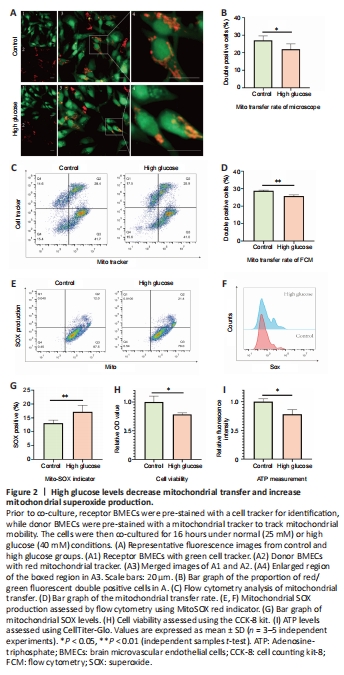
A previous study found that elevated glucose levels led to a reduction in mitochondrial motility within rat hippocampal axons, resulting in an aberrant distribution of mitochondria within neurons (Pekkurnaz et al., 2014). To assess the effects of high glucose levels on intercellular mitochondrial transfer and function, receptor BMECs and donor BMECs were co-cultured under normal glucose (25 mM) or high glucose (40 mM) conditions. Using fluorescence microscopy, we found that the percentage of red/green fluorescent co-stained BMECs was slightly lower in the high glucose group than the control group (Figure 2A and B). We then used flow cytometry to further semi-quantitatively analyze the proportion of co-stained BMECs and found that double positive cells (Q2) were lower in the high glucose group. This implies a lower level of mitochondrial transfer (Figure 2C and D). Additionally, we evaluated mitochondrial function by measuring mitochondrial ROS levels. Figure 2E and F shows two distinct cell populations: superoxide (SOX)-high-positive (Q1) and SOX-low-negative (Q4). Our results indicated that high glucose treatment led to an increase in SOX production (Figure 2G), indicative of mitochondrial dysfunction. Furthermore, we examined cellular viability and energy metabolism and found that high glucose treatment resulted in a decline in ATP levels and cell viability (Figure 2H and I).
Figure 3|Post-OGD hyperglycemia inhibits mitochondria transfer from healthy to damaged BMECs.
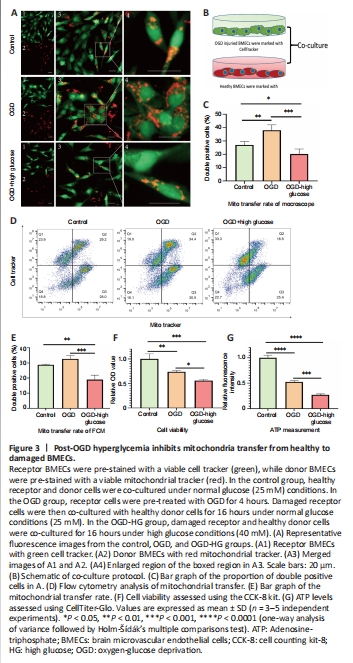
We developed an in vitro model of post-OGD hyperglycemia by administering high glucose during the reoxygenation stage after OGD injury. Briefly, receptor BMECs labeled with a green viable cell tracker were subjected to 4 hours of OGD pre-treatment. Subsequently, damaged receptor BMECs were co-cultured with healthy donor BMECs labeled with a red viable mitochondrial tracker for 16 hours. We found that OGD-injured BMECs received more viable mitochondria from healthy BMECs, as shown by a higher percentage of co-stained BMECs in the OGD group compared with the control group. However, high glucose stimulation during the reoxygenation stage significantly deceased the proportion of co-stained BMECs in the OGD-HG group (Figure 3A–C), indicating that post-OGD hyperglycemia may inhibit mitochondria transfer from healthy to damaged cells. Flow cytometry was then used to further semi-quantitatively analyze the proportion of co-stained BMECs. We found that double positive cells (Q2) were lower in the OGD-HG group compared with the control and OGD groups (Figure 3D and E), which is consistent with our fluorescence microscopy results. At the same time, post-OGD hyperglycemia also considerably decreased cell viability (Figure 3F) and ATP content (Figure 3G) of BMECs.