脊髓损伤
-
Figure 1| Characterization of BMSC-derived SEVs and HSEVs.
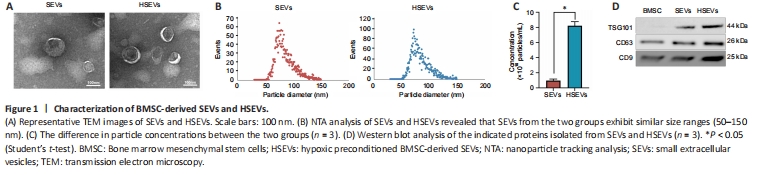
BMSCs grew adherently and were fusiform or irregularly triangular in shape at 80–90% confluency (Additional Figure 1A). Adipogenic (Additional Figure 1B), osteogenic (Additional Figure 1C), and chondrogenic differentiation (Additional Figure 1D) of BMSCs was confirmed using appropriate kits (described in the Methods). Flow cytometry analysis confirmed that BMSCs were positive for CD90 and CD29, but negative for CD34 and CD45 (Additional Figure 1E). BMDMs were isolated from rat bone marrow as described in the Methods and cultured until day 7 (Additional Figure 1F), when their identity was confirmed by flow cytometry and their purity was confirmed by Iba1 staining (Additional Figure 1G). SEVs and HSEVs were isolated from BMSC culture supernatants by density gradient ultracentrifugation and analyzed by electron microscopy, NTA, and western blotting. A typical exosome structure was observed by transmission electron microscopy (Figure 1A). The NTA results for SEVs (average particle size: 84.82 nm, range: 52.25–149.25 nm) and HSEVs (average particle size: 84.04 nm, range: 50.25–148.75 nm) showed similar particle size distributions (Figure 1B), and the concentration of particulates was higher under anoxic conditions than under normoxic conditions (Figure 1C). Western blotting was used to detect the cellular markers CD63, CD9, and TSG101 in the SEVs (Figure 1D).
Figure 2|BMSC-derived HSEVs promote motor function recovery in SCI rats.

To determine whether exosomes from MSCs exposed to hypoxic conditions improve motor function after SCI, we first assessed functional recovery in SCI rats treated with PBS, SEVs, or HSEVs using BBB scoring. At 14, 21, and 28 days post-injury, rats in the SEV group exhibited superior functional improvement compared with those in the PBS group (P < 0.05). Notably, at the 28-day mark post-injury, the BBB scores of the HSEV group significantly exceeded those of the SEV group (P < 0.05; Figure 2A). Electrophysiological testing of rat hind limbs supported the conclusions derived from the BBB scores (Figure 2B). On day 28 after injury, the area under the curve (Figure 2C) and amplitude (Figure 2D) of motor-evoked potentials in the HSEV group were significantly higher than those in the SEV group (P < 0.05), indicating that the hind limbs showed better neurological status after HSEV administration. Gait analysis indicated that hind limb gait recovery was significantly better in the SEV (P < 0.05) and HSEV (P < 0.05) groups than in the PBS group (Figure 2E–H). H&E staining of the spinal cord showed that the areas of the spinal cord lesions in the SEV (P < 0.05) and HSEV groups (P < 0.05) were significantly smaller than those in the PBS group, and the lesion areas in the HSEV group were significantly smaller than those in the SEV group (P < 0.05; Figure 2I and J). These results indicate that BMSC-derived SEVs or HSEVs reduced the severity of SCI in rats, and that HSEVs were more effective than SEVs.
Figure 3| Effect of BMSC-derived HSEVs on local M1/M2 subpopulation ratio in the injured rat spinal cord.
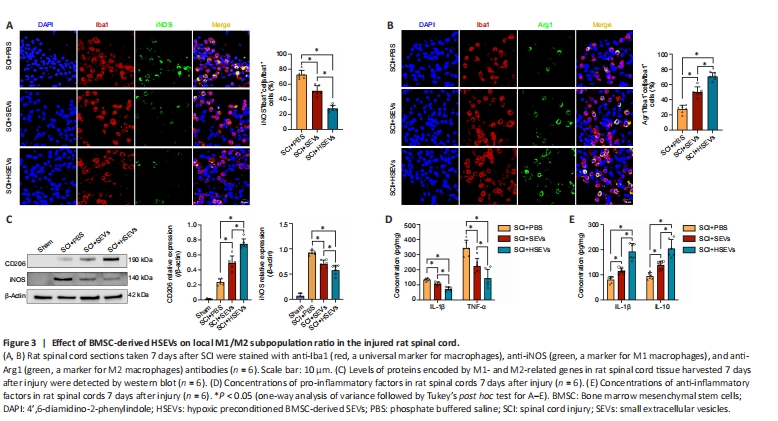
During SCI, macrophages may regulate the progression of inflammation by altering their polarization state. In this study, we found that BMSC-derived SEVs and HSEVs improved motor function after SCI. To determine whether this phenomenon was associated with SEV- or HSEV-mediated modulation of macrophage polarization, macrophage M1/M2 subsets were detected by immunofluorescence in spinal cord sections from rats 7 days post-injury. The results demonstrated a significant decrease in the proportion of Iba1+iNOS+ cells (M1 subtype) within both the SEV group (P < 0.05) and the HSEV group (P < 0.05) compared with that in the PBS group (Figure 3A). Additionally, a notable increase was observed in the proportion of Iba1+Arg1+ cells (M2 subtype) in the SEV (P < 0.05) and HSEV groups (P < 0.05) compared with that in the PBS group (Figure 3B). Comparing with the SEV group, the proportion of Iba1+iNOS+ cells was significantly decreased (P < 0.05), and the proportion of Iba1+Arg+ cells was significantly increased, in the HSEV group (P < 0.05). Next, total protein was extracted from rat spinal cord tissue 7 days after injury and subjected to western blot analysis. The results showed that, compared with the findings in the SEV group, the reduction in iNOS expression (P < 0.05) and the increase in CD206 expression (P < 0.05) were more pronounced in the HSEV group (Figure 3C). Seven days after SCI, we measured concentrations of the pro-inflammatory cytokines TNF-α and IL-1β and the anti-inflammatory cytokines TGF-β and IL-10 in the rat spinal cord by enzyme-linked immunosorbent assay. The administration of either SEVs (P < 0.05) or HSEVs (P < 0.05) significantly decreased the concentrations of pro-inflammatory cytokines compared with the findings in the PBS control group (Figure 3D). The inhibition of pro-inflammatory cytokine secretion was more pronounced in the HSEVs group compared with that in the SEVs group (P < 0.05). Additionally, the administration of either SEVs (P < 0.05) or HSEVs (P < 0.05) significantly increased the concentrations of anti-inflammatory cytokines compared with the findings in the PBS control group (Figure 3E). The promotion of anti-inflammatory cytokine secretion was more pronounced in the HSEV group compared with that in the SEV group (P < 0.05). These results indicate that BMSC-derived SEVs or HSEVs effectively altered the balance of the M1/M2 subpopulations, and that HSEVs were more effective than SEVs at promoting M2 polarization.
Figure 4|BMSC-derived HSEVs trigger polarization of primary macrophages (BMDMs) from an M1 to an M2 phenotype in vitro.
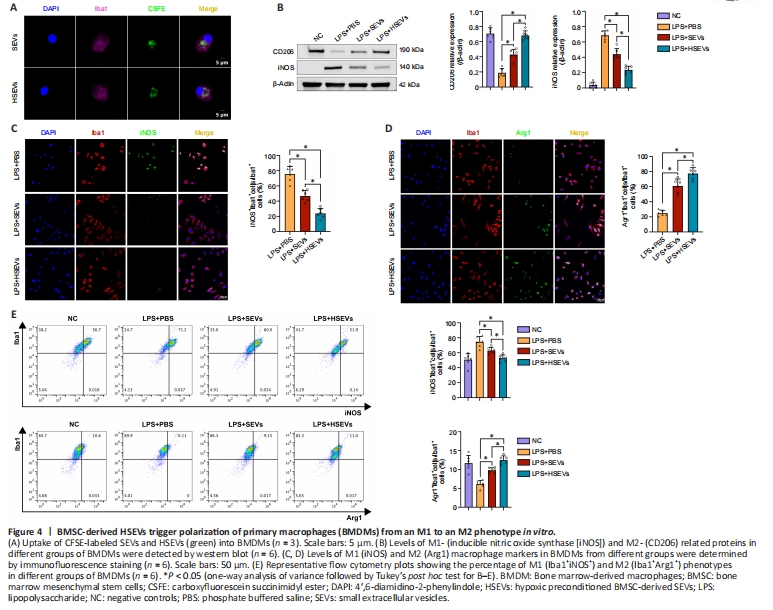
We demonstrated that SEVs/HSEVs alter local M1/M2 subpopulations in the injured spinal cord. Next, we asked whether SEVs or HSEVs exert similar therapeutic effects in vitro as those observed in vivo. To test this, mononuclear cells were isolated from rat bone marrow and cultured under macrophage colony stimulating factor stimulation for 7 days to obtain BMDMs. When CFSE-labeled SEVs or HSEVs were added to the BMDM culture medium, they were taken up by the BMDMs and were visible in the cytoplasm within 12 hours (Figure 4A). LPS (50 ng/mL) was added to the culture medium, and BMDMs were incubated for 12 hours to induce an inflammatory microenvironment before the being incubated with PBS, SEVs, or HSEVs for 24 hours. Western blot analysis showed downregulation of iNOS and increased expression of CD206 in the SEV (P < 0.05) and HSEV groups (P < 0.05) compared with the findings in the PBS group (Figure 4B), similar to the in vivo results. Cell immunofluorescence analysis revealed downregulation of iNOS and increased Arg-1 expression in the SEV (P < 0.05) and HSEV groups (P < 0.05; Figure 4C and D) compared with the findings in the PBS group, with more pronounced effect in the HSEV group than in the SEV group (P < 0.05). Flow cytometric analysis of the polarization state of M1/M2 BMDMs showed that HSEVs exerted more beneficial effects than SEVs (Figure 4E). These results suggest that HSEVs plays a more pronounced role than SEVs in regulating BMDM polarization toward an M2 phenotype in vitro, further confirming the in vivo results.