脑损伤
-
Figure 5|rTMS promotes the remodeling of synaptic structures after TBI.

PSD thickness, synaptic cleft width, and synaptic AZ length were observed under transmission electron microscopy. PSD thickness was thinner, synaptic cleft width was increased, and the synaptic AZ was shortened in the TBI group than in the sham group (P < 0.01). rTMS treatment mitigated these structural changes (P < 0.01, vs. TBI group; Figure 5).
Figure 6| rTMS reduces the loss of SYN after TBI.
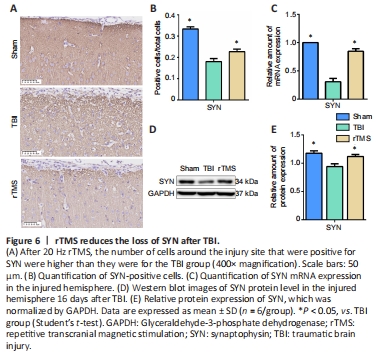
SYN protein and mRNA levels were examined at 16 days after TBI using immunochemistry and western blot assay. Weak immunopositive SYN staining was observed in the TBI group but not in the sham group (F = 1.198, t = 8.204, dt = 10, P < 0.01). After rTMS treatment, strong immunohistochemical staining for SYN was observed in the cytoplasm of cells around the injury site (F = 0.683, t = 2.321, dt = 10, P = 0.043). SYN protein levels in the TBI group were significantly lower than those in the sham group, indicating loss of synapses (F = 0.327, t = 3.659, dt = 10, P < 0.01). They were also significantly lower than in the rTMS group (F = 0.768, t = 2.928, dt = 10, P = 0.015), indicating that rTMS led to an increase in synapses. Similarly, SYN mRNA expression in the TBI group was significantly lower than that in the sham group (F = 90.250, t = 11.857, dt = 10, P < 0.01), but higher after rTMS treatment (F = 2.317, t = 7.3, dt = 10, P < 0.01; Figure 6).
Figure 7| rTMS increases the number of BDNF, TrkB, NMDAR1, and P-CREB positive cells around the injured area after TBI.
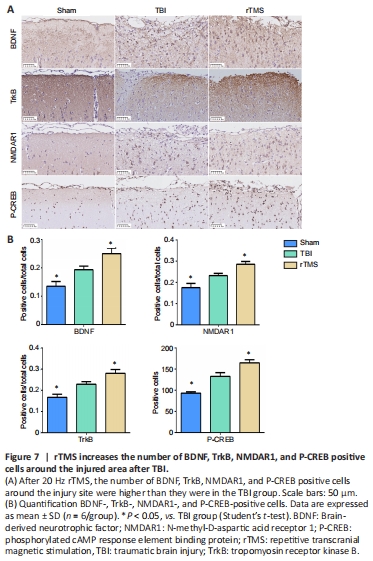 Protein levels for BDNF, TrkB, NMDAR1, and P-CREB in the injured cortex were assessed at 16 days after TBI using immunochemistry. The cytoplasm of cells around the injury site showed stronger immunohistochemical staining for positive cells of BDNF (F = 0.932, t = –2.498, P = 0.032), TrkB (F = 0.137, t = –3.295, P < 0.01), NMDAR1 (F = 0.653, t = –2.426, P = 0.036), and P-CREB (F = 6.085, t = –4.268, P < 0.01) in the TBI group than in the sham group. The percentage of positive cells increased after rTMS treatment for positive cells of each protein (BDNF: F = 1.031, t = 2.70, P = 0.022, rTMS vs. TBI group, TrkB: F = 1.288, t = 2.345, P = 0.041, rTMS vs. TBI group, NMDAR1: F = 0.143, t = 3.059, P = 0.012, rTMS vs. TBI group, P-CREB: F = 0.621, t = 2.826, P = 0.018, rTMS vs. TBI group; Figure 7).
点击此处查看全文