脑损伤
-
Figure 2|Protein expression of HCN1 and HCN2 in the CA1 region after SE.
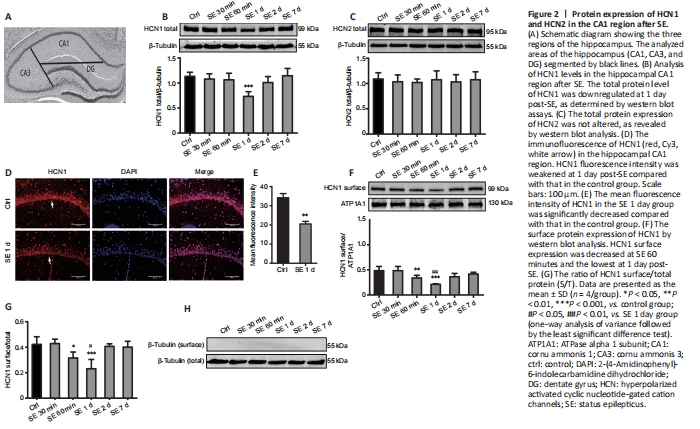
Brains were rapidly harvested from anesthetized rats and submerged in ice-cold NS. The division of three regions of the hippocampus under a dissecting microscope (Li et al., 2014) is shown in Figure 2A.
HCN channels consist of four subunits (HCN1–4) (Berrera et al., 2006), among which, HCN1 and HCN2 represent the major subunits in the brain (Brewster et al., 2005). Here, we analyzed the expression of HCN1 and HCN2 proteins in the hippocampal CA1 region over time after SE using western blot assays. The results showed that HCN1 total protein was significantly downregulated at 1 day post-SE and was lower than that in the control group (P < 0.001; Figure 2B). There was no significant change in HCN2 total protein expression in CA1 regions between different times post-SE (P > 0.05; Figure 2C). These results were consistent with the findings of a previous study by Brennan et al. (2016). Immunofluorescence staining results revealed a significant decrease in HCN1 intensity at 1 day post-SE compared with that in the control group (P < 0.01; Figure 2D and E). Collectively, these results suggested that HCN1 may play a crucial role in the mechanism underlying the pathophysiology of early-stage SE. Therefore, we further determined the change in HCN1 surface expression. The profiles of HCN1 surface expression in CA1 are shown in Figure 2F. HCN1 surface expression rapidly decreased at 60 minutes post-SE (P < 0.01) compared with that in the control group, decreased to the lowest point at 1 day post-SE (P < 0.001), and then slightly but significantly recovered at 2 days post-SE (P > 0.05). HCN1 surface expression was decreased at 1 day post-SE compared with that in the SE 60 minutes group (P < 0.01; Figure 2F). The ratio of HCN1 S/T was approximately 44.2 ± 3.2% in the control group (Figure 2G). Notably, this ratio decreased at 60 minutes (P < 0.05; Figure 2G) and was the lowest at 1 day post-SE (P < 0.001; Figure 2G) compared with that in the control group. Consistent with HCN1 surface expression, the HCN1 S/T ratio was also decreased at 1 day post-SE compared with that in the SE 60 minutes group (P < 0.05; Figure 2G). Western blot analysis of surface protein extracts demonstrated no reactivity with anti-β-tubulin antibodies, indicating no cross-contamination of cytoplasmic fractions (Figure 2H). Collectively, these results demonstrated the downregulation of total and surface HCN1 protein expression post-SE. However, HCN1 surface protein was downregulated at 60 minutes post-SE, earlier than HCN1 total protein. Moreover, the S/T ratio was lowest at 1 day post-SE.
Figure 3|NeuN-positive cells and NeuN protein in the hippocampal CA1 region after SE.
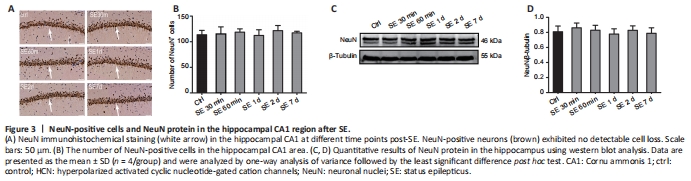
A previous study showed that SE may cause neuronal death and subsequent neuronal loss (Yi? et al., 2013), processes that are also responsible for the suppression of HCN channels (Lin et al., 2020). In fact, the suppression of NeuN-positive neurons indicates the loss of neurons (Mullen et al., 1992; Vasilev et al., 2018). To explore whether PTZ-induced SE causes neuronal death or loss, we performed NeuN immunohistochemical staining of hippocampal sections followed by western blot assays in experiment 1. The results revealed the abundance of NeuN-positive neurons in the CA1 region of the hippocampus, with no statistically significant difference between the control and post-SE groups (P > 0.05; Figure 3A and B). Similarly, we found no significant changes in NeuN protein expression between control and post-SE groups (P > 0.05; Figure 3C and D). Taken together, these results indicated that PTZ-induced SE does not induce early neuronal loss in the hippocampal CA1 region, and suppression of the HCN1 channel post-SE is not caused by changes in the number of neurons.
Figure 4|Protein expression of EAAT2 and mGluR1 in the hippocampal CA1 region after SE.

Glutamatergic neurotransmission is considered an underlying factor of epilepsy (Guo et al., 2010), and endogenous glutamate is elevated after SE (Kanda et al., 1996). Most endogenous glutamate produced during epilepsy is removed through excitatory amino acid transporters (EAATs) and glutamate receptors (Guo et al., 2010). Notably, EAAT2 has been reported to be responsible for up to 90% of the total glutamate uptake (Tanaka et al., 1997), with the upregulation of EAAT2 protein shown to be a marker of increased glutamate concentrations (Vasilev et al., 2018). The results of experiment 1 showed that EAAT2 protein was significantly upregulated post-SE, specifically at 60 minutes (P < 0.01), 1 day (P < 0.01), and 2 days (P < 0.05), and the degree of upregulation was higher than that in the control group (Figure 4A and B). Previous studies have shown that excess extracellular glutamate is an important risk factor for epilepsy as it over-activates glutamate receptors (Salt and Cordeiro, 2006; Seki and Lipton, 2008). In addition, evidence indicates an increase in glutamate binding to elevated group I mGluRs (mGluR1 and mGluR5) (Schr?eder et al., 1999). In this study, we focused on mGluR1 expression owing to its relevance in the occurrence of epilepsy (Aronica et al., 2003). Our results showed that mGluR1 protein was significantly upregulated in the hippocampal CA1 region at 60 minutes post-SE (P < 0.05) and increased to the highest level at 1 day (P < 0.01) post-SE, followed by returning to control levels at 2 days (P > 0.05; Figure 4A and C).
The above results revealed upregulated mGluR1 protein and downregulated HCN1 protein at 1 day post-SE in the hippocampal CA1 region. This contrasting pattern of expression led us to hypothesize that the two proteins might be correlated. Previous studies have reported that HCN1 and mGluR1 are co-localized in the soma and apical dendrites of anterior cingulate cortex layer 5 pyramidal neurons (Gao et al., 2016). Therefore, we applied double immunofluorescence labeling to analyze their relationship in the hippocampal CA1 region in experiment 1. The results revealed that HCN1 and mGluR1 were co-localized in hippocampal CA1 pyramidal neurons (Figure 4D).
Figure 5|Western blot analysis and immunofluorescence staining showing HCN1 and mGluR1 protein expression after SE in the presence of DHPG or LY367385.

Previous studies have shown that the activation of mGluRs potentially reduces HCN channels function by altering kinase activity and inducing entorhinal cortex plasticity (Brager and Johnston, 2007). The results of the present study revealed the upregulation of EAAT2, which subsequently activated mGluR1. Moreover, HCN1 channel protein was downregulated almost simultaneously, especially at 1 day post-SE. Double immunofluorescence labeling results in experiment 1 indicated that mGluR1 and HCN1 were co-localized in hippocampal CA1 pyramidal neurons. Thus, we hypothesized that increased glutamate after SE may activate mGluR1 expression, thereby inhibiting HCN1 channel to test this hypothesis, we evaluated the effect of mGluR1 agonist and antagonist on HCN1 channel. In part I of experiment 2, groups without PTZ administration showed no spontaneous epileptic seizures after the intracerebroventricular injection of drugs. Next, we evaluated changes in the expression of mGluR1 and HCN1 proteins in our model via western blot assays and immunofluorescence staining. The results revealed the significant downregulation of HCN1 total protein in the DHPG group (P < 0.05), whereas mGluR1 protein was significantly upregulated in the DHPG group compared with that in the NS group (P < 0.01; Figure 5A–C). This effect simulated the alteration in HCN1 and mGluR1 protein at 1 day post-SE. These results imply that mGluR1 activation simultaneously upregulated mGluR1 and downregulated HCN1. Moreover, total HCN1 protein was slightly upregulated in the LY367385 group, although this was not significantly different compared with that in the NS group (P > 0.05; Figure 5A–C). Conversely, mGluR1 protein was significantly downregulated in the LY367385 compared with that in the control group (P < 0.05; Figure 5A–C). The results from double immunofluorescence labeling corroborated those from western blot assays (Figure 5D–F).