视神经损伤
-
Figure 3|piR-1245 has no effect on HRECs in normoxic conditions.
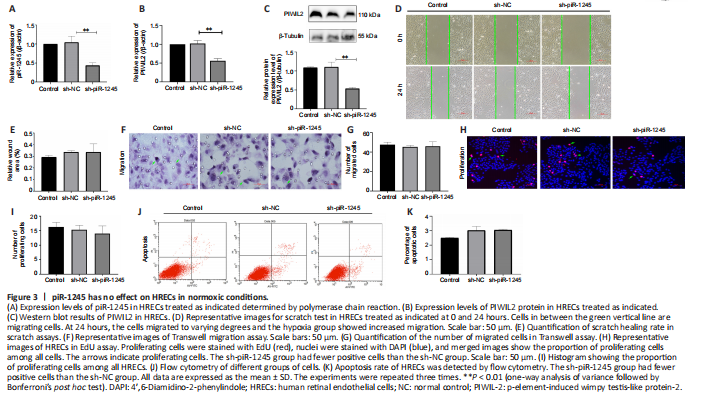
To study the effect of piR-1245 on the function of HRECs cells under normoxia, we knocked down piR-1245 of HREC cells and observed it under normoxia. The expression level of piR-1245 in the sh-piR-1245 group was lower than that in the sh-NC group (P < 0.01), and the protein expression level of PIWIL2 in the sh-piR-1245 group was lower than that in the sh-NC group (P < 0.05; Figure 3A–C).
The results of flow cytometry showed that under normoxia, there was no significant change in the apoptosisof HREC in response to piR-1245 knockdown. The results of Transwell assay and scratch assay showed that under normoxia, there was no significant change in the migration of HREC in response to piR-1245 knockdown. The results of EdU assay showed that under normoxia, there was no significant change in the proliferation of HREC in response to piR-1245 knockdown (all P > 0.05; Figure 3A–K).
Figure 4|piR-1245 knockdown inhibits HREC apoptosis, proliferation, migration and tube formation in hypoxic conditions.
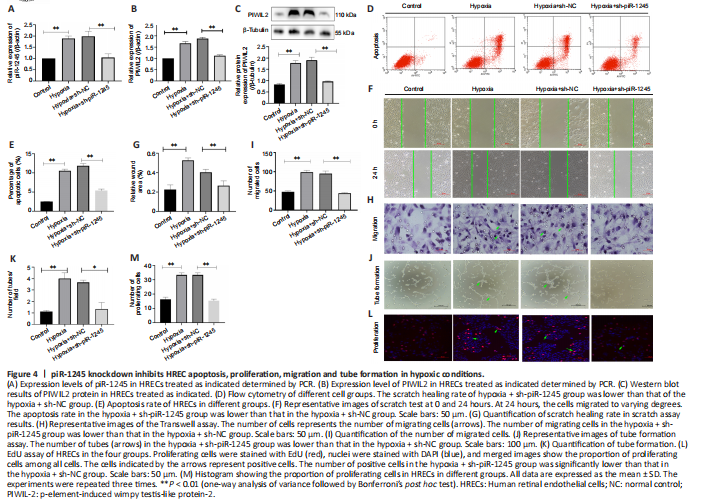
RNV is mainly due to ischemia and hypoxia, so we studied the pathophysiological changes of HRECs under hypoxia. The expression levels of piR-1245 and PIWIL2 in HRECs of hypoxia and hypoxia + sh-NC groups were significantly higher than those in the hypoxia + sh-piR-1245 and control groups (all P < 0.05; Figure 4A–C).
Flow cytometry results indicated that the apoptosis rate of the hypoxia group was significantly higher than that of the control group (P < 0.05). Furthermore, the apoptosis rate was significantly lower in the hypoxia + sh-piR-1245 cells than that in hypoxia + sh-NC cells (P < 0.05; Figure 4D and E). A migration scratch assay revealed that the migration rate of the hypoxia group was significantly higher than that of the control group (P < 0.05). Additionally, the migration rate of the hypoxia + sh-piR-1245 group was significantly lower than that of the hypoxia + sh-NC group (P < 0.05; Figure 4F and G). The results of the Transwell assay were in line with those of the scratch assay (Figure 4H and I). Tube formation assay showed that number of tubes formed by the hypoxia group was significantly higher than that in the control group (P < 0.05), while significantly fewer tubes were formed in the hypoxia + sh-piR-1245 group than in the hypoxia + sh-NC counterparts (P < 0.05; Figure 4J and K). EdU assay showed that the number of proliferating cells in the hypoxia group was significantly higher than that in the control group (P < 0.05), while fewer proliferating cells were observed in the hypoxia + sh-piR-1245 group than in the hypoxia + sh-NC group (P < 0.05; Figure 4L and M). piR-1245 knockdown inhibited the proliferation, migration, and tube formation of HRECs under hypoxic conditions.
Figure 7|Intravitreal injection of piR-1245 inhibits RNV, regulates JAK2/STAT3 activation and VEGF expression in the retina.
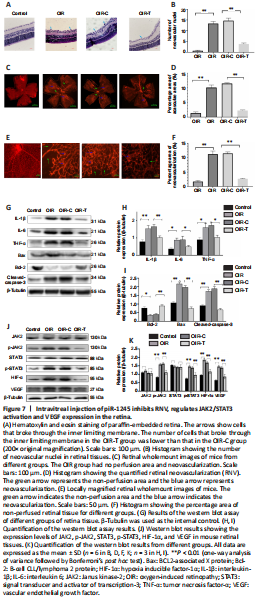
We next examined the role of piR-1245 on RNV using a mouse model of oxygen-induced retinopathy (OIR; Figure 2). Mice were divided into four treatment groups: control, OIR, OIR + intravitreal injection of control lentivirus (OIR-C), and OIR + intravitreal injection of piR-1245 knockdown lentivirus (OIR-T). The degree of retinopathy in mouse tissue was assessed using retinal wholemount staining and HE staining (Figure 7A–F). Retinal wholemount staining indicated that the retinal tissues of control and OIR-T mice exhibited a clear and regular blood vessel course, without bleeding points or leaks. OIR and OIR-C retinal tissues had tortuous and occluded retinal blood vessels, bleeding and leakage, NV clusters, and large non-perfused areas. The non-perfused area and NV area in the OIR group was significantly greater than those in the control group (P < 0.05). Furthermore, the non-perfused area and NV area of OIR-C samples were significantly greater than in OIR-T group (both P < 0.05). HE staining revealed that the number of EC nuclei that had crossed the inner limiting membrane on the vitreous side was significantly greater in the OIR group than that in the control group (P < 0.05). Furthermore, the area of neovascular nuclei in the OIR-C group was significantly greater than that in the OIR-T group (P < 0.05).
Western blot assay was performed to determine the protein levels of inflammatory factors in retinal tissue. While expression levels of IL-1β, IL-6, and TNF-α were significantly higher in the OIR group than those in the control group (all P < 0.05), these levels were significantly lower in the OIR-T group than those in the OIR-C group (all P < 0.05; Figure 7G–I). Thus, the OIR-T group exhibited a significantly suppressed inflammatory response. Additionally, while cleaved caspase-3 and Bax levels were significantly higher and Bcl-2 was significantly lower in the OIR group than those in the control group (P < 0.05), cleaved caspase-3 and Bax levels were significantly lower and Bcl-2 was significantly higher in the OIR-T group than those in the OIR-C group (P < 0.05). Thus, the OIR-T group exhibited a significantly suppressed inflammatory response. These data indicated that intravitreal injection of piR-1245 knockdown lentivirus suppressed the inflammatory response and reduced retinal tissue apoptosis in the OIR model.
We further found that while expression levels of p-JAK2, p-STAT3, HIF-1α, and VEGF were significantly higher in the OIR group than those in the control group (all P < 0.05), these levels were significantly lower in the OIR-T group than those in the OIR-C group (all P < 0.05) (Figure 7J–K). Thus, the OIR-T group exhibited a significantly suppressed inflammatory response in retinal blood vessels through the JAK2/STAT3 pathway.
Figure 8|Intravitreal injection of p-JAK2 inhibitor relieves RNV.
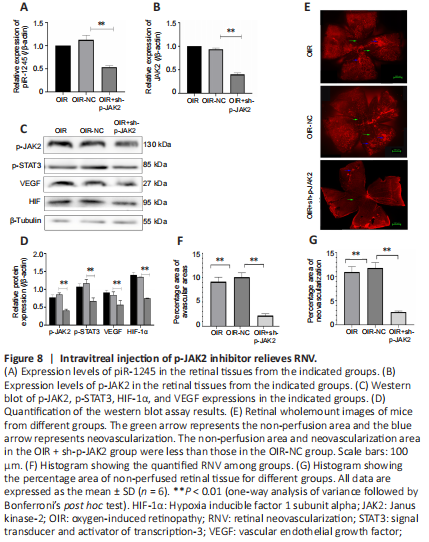
The mice in the OIR + sh-p-JAK2 group were intravitreally injected with p-JAK2 inhibitor, and the mice in the OIR-NC group were used as a control. The expression levels of p-JAK2, p-STAT3, HIF-1α, and VEGF were significantly lower in the OIR + sh-p-JAK2 group than those in the OIR and OIR-NC groups (all P < 0.05; Figure 8). This result indicates that p-JAK2 inhibitor can regulate VEGF and HIF-1 in vivo α which in turn inhibits the generation of RNV.