脊髓损伤
-
Figure 1|Flowchart of the experimental procedure.
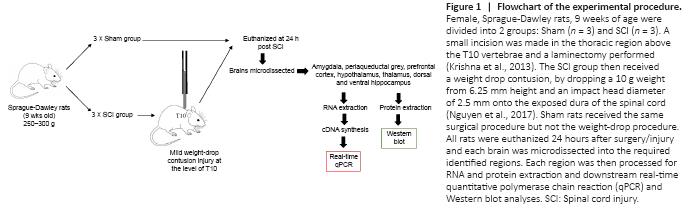
Six adult female Sprague-Dawley rats (9 weeks old, body weight 250–300 g) were acquired from the Animal Resource Centre (Perth, WA, Australia). Rats were housed in cages on a 12-hour dark-light cycle with unlimited access to food and water. Each cage was provided with environmental enrichment. Animals were assigned randomly to either; (1) mild contusion SCI group (SCI; n = 3), or (2) sham surgery group (Sham; n = 3) (Figure 1).
Figure 2|Schematic depicting rat brain microdissection procedures.
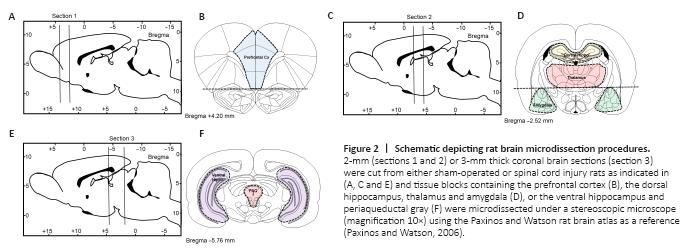
Prefrontal cortex: In the most anterior tissue block we isolated the medial prefrontal cortex, the first coronal section was cut between bregma levels +4.68 mm and +2.52 mm (Figure 2A). Thereafter, we removed the anterior olfactory nucleus which occupies the ventral 1.5 mm of this section (Figure 2B) and then made two parasagittal cuts approximately 1 mm lateral to the midline abutting the forceps minor.
Amygdala: Similar to the prefrontal cortex, a 2-mm thick coronal section was cut between –1.92 mm and –3.96 mm caudal to bregma (Figure 2C). To obtain a block that included the entire amygdaloid complex, we used the opening of the lateral ventricle as a reference point to further dissect the triangular shaped area of the amygdala from each side located approximately 4 mm from the midline (Figure 2D).
Thalamus: To obtain lateral thalamus samples, we used the same tissue blocks used to isolate the amygdala. The hypothalamus was isolated from the remaining tissue block and using the internal capsule as the lateral boundary and the dorsal opening of the 3rd ventricle as the upper boundary we micro-dissected the lateral thalamus from each side as two semi-rectangular tissue samples (~8 mm × ~2 mm) (Figure 2D).
Dorsal hippocampus: was isolated from the same tissue block used to isolate the amygdala and lateral thalamus. The right and left dorsal hippocampi are easily identified and isolated. The tissue was separated from the cortical layer above and the corpus callosum (Figure 2D).
Ventral hippocampus: The ventral hippocampus was dissected from the most caudal tissue block and was isolated from a smaller tissue block approximately –4.6?mm to –7.8 mm caudal to bregma (Figure 2E). The ventral hippocampus was isolated from the surrounding cortex under a dissecting microscope using the thin layer of white matter surrounding the lateral boundary for reference, the tissue was removed with Dumont #7 forceps (Fine Science Tools, North Vancouver BC, Canada) (Figure 2F).
Periaqueductal gray (PAG): The tissue block used to isolate the ventral hippocampus was used to isolate the PAG. The PAG is a tubular-shaped region of the midbrain surrounding the cerebral aqueduct which resulted in a tissue sample of about 2 mm diameter (Figure 2F).
Figure 4|Western blot analyses of GFAP protein expression in the amygdala, periaqueductal gray, prefrontal cortex, hypothalamus, thalamus, ventral & dorsal hippocampus of sham-injured (Sham) and spinal cord injury rats.
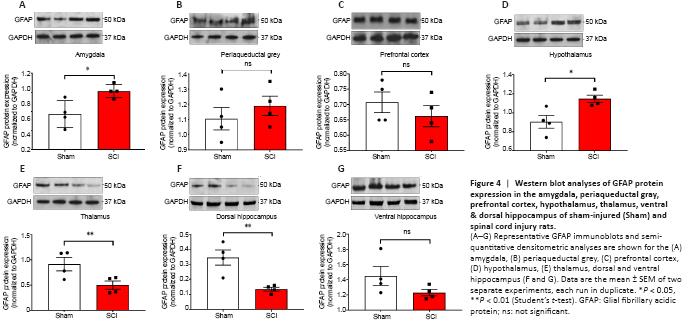
The acute effects of SCI on the expression of GFAP in the amygdala and PAG, two regions pivotal in mediating emotional coping behaviours and that play important roles in the development of the behavioural dysfunction comorbid with injury and trauma (Keay and Bandler, 2001; Phelps and LeDoux, 2005; Mor et al., 2015; Motta et al., 2017), were evaluated. Figures 3A and 4A show that GFAP mRNA and protein expression levels were significantly upregulated in the amygdala compared to Sham controls (t10 = 2.261 and t6 = 3.061, P < 0.05), whereas in the PAG, the expression of GFAP mRNA and proteins were not significantly affected 24 hours after SCI (Figures 3B and 4B; t10 = 1.144 and t6 = 0.872, P > 0.05 for GFAP). Figures 3C and 4C show that GFAP expression in the prefrontal cortex was unchanged 24 hours after SCI (t10 = 0.630 for mRNA and t6 = 0.936, P > 0.05 for GFAP), whereas hypothalamic GFAP mRNA and protein expression was significantly increased at this time (Figures 3D and 4D, t10 = 2.490 and t6 = 3.123, P < 0.05).
The thalamus receives a substantial spinal input and is the critical relay for somatosensory inputs to the cerebral cortex (Yuan et al., 2016); it also receives substantial inputs from spinal recipient brainstem regions, including projections from the ventro-lateral portion of the PAG carrying deep noxious inputs (Floyd et al., 1996), therefore we sought to determine if SCI altered GFAP expression in the thalamus. We report a surprising, and robust decline in GFAP transcript levels at this acute, 24-hour time-point (Figure 3E, t10 = 3.488, P < 0.01), which was further confirmed by protein analyses (Figure 4E, t6 = 2.684, P < 0.01).
GFAP expression in the hippocampus was also significantly reduced in the dorsal hippocampus both at the mRNA (Figure 3F, t10 = 2.500, P < 0.05) and even more robustly at the protein level (Figure 4F, t6 = 4.029, P < 0.01), but not in the ventral hippocampus of SCI rats (Figure 3G and 4G, t10 = 1.474 and t6 = 1.659, P > 0.05).
Figure 6|Western blots analyses of Iba1 protein expression in the amygdala, periaqueductal gray, prefrontal cortex, hypothalamus, thalamus, ventral & dorsal hippocampus of sham-injured (Sham) and spinal cord injury rats.
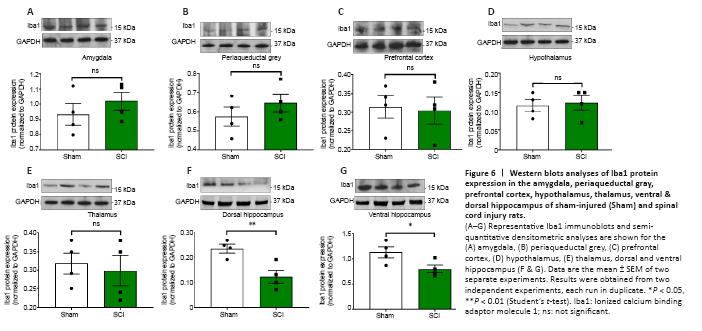
24 hours post SCI the mRNA and protein expression of the microglial marker Iba1 were unaffected in the amygdala (Figures 5A and 6A, t10 = 0.514 and t6 = 0.936, P > 0.05); the PAG (Figures 5B and 6B, t10 = 0.186 and t6 = 1.059, P > 0.05); the prefrontal cortex (Figures 5C and 6C; t10 = 1.342 and t6 = 0.216, P > 0.05); the thalamus (Figures 5E and 6E, t10 = 1.148 and t6 = 0.406, P > 0.05) and the hypothalamus (Figures 5D and 6D, t10 = 0.248 and t6 = 0.307, P > 0.05). In contrast, Iba1 mRNA and protein expression levels in the hippocampus were reduced in both the dorsal hippocampus (Figures 5F and 6F, t10 = 2.292 and t6 = 3.739, P < 0.05 and P < 0.01, respectively) and the ventral hippocampus (Figures 5G and 6G, t10 = 2.251 and t6 = 2.453, P < 0.05).