周围神经损伤
-
Figure 1|The operation procedure.

All animals were anesthetized via inhalation of 2.5% isoflurane (RWD, Shenzhen, China) using an anesthesia machine for small animals (R500; RWD). Then, the right sciatic nerve was exposed and a segment of the nerve was removed to create a 10-mm-long defect. The resected nerve segment was used to bridge the gap forward by epineural neurorrhaphy in the Autograft group. The gap in the C/Hollow group was bridged with a hollow chitin biological conduit. In the C/SAN group, a small branch of the sciatic nerve from the same animal (10 mm long after retraction) was resected and located in a chitin conduit. The conduit with the nerve was used to bridge the gap. In the C/SAN-ER group, the epineurium of the small branch of the sciatic nerve was stripped before it was placed in the chitin conduit. Otherwise, conditions were the same as in the C/SAN group. The skin was sutured and all rats were housed and fed as usual. The rats were given analgesic jelly after the operation to prevent pain. The animals were carefully observed every day and when signs of autotomy were found, picric acid solution (Sigma-Aldrich (Shanghai) Trading Co. Ltd.) was applied to prevent it from worsening (Firouzi et al., 2015). A schematic diagram of the operation is shown in Figure 1.
Figure 2|Appearance and mechanical properties of the chitin conduits.
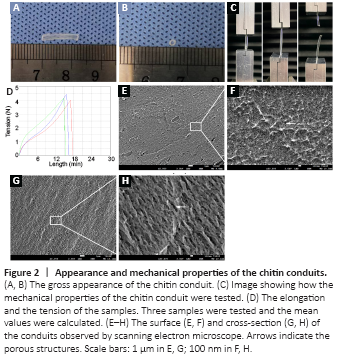
The chitin conduits were generally transparent (Figure 2A and B). Their elongation at the time of break was 119.45 ± 4.21%, and their tensile strength was 2.34 ± 0.12 MPa (Figure 2C and D). In the water penetration test, the filter paper under the membrane was dyed purple (Additional Figure 2E) and the membrane remained intact without damage (Additional Figure 2F), indicating that the crystal violet solution can permeate through the chitin membrane. Scanning electron microscopy pictures of the cross-section and the surface of the conduits showed nanoscale porous structures (Figure 2E–H).
Figure 3|Chitin scaffold combined with autologous small nerve improves motor function recovery in rats 12 weeks after induction of sciatic nerve defects.

Twelve weeks after the surgery, gait analysis was carried out to assess motor function recovery. Sciatic nerve injury leads to an increase in footprint length, foot drop, and reduces the distance between toes. Representative footprints graphed by the Catwalk system are shown in Figure 3A. The toes on the right side (injured) in autograft and C/SAN and C/SAN-ER groups were more spread out than those in the C/Hollow group. Furthermore, qualitative analysis (Figure 3B) showed that SFI values were higher in the C/SAN and C/SAN-ER groups than in the C/Hollow group (P < 0.01), while no difference was found between the C/SAN and C/SAN-ER groups (P = 0.588). The SFI values in the Autograft group were significantly higher than those in the other groups (P < 0.01).
Meanwhile, footprint intensity is qualitative indication of motor function recovery (Sun et al., 2018) (Figure 3C). The R/L ratios were higher in the C/SAN and C/SAN-ER groups than in the C/Hollow group (P < 0.05), and not different from the Autograft group (P > 0.05; Figure 3D).
Figure 4|Chitin scaffold combined with autologous small nerve improves the electrophysiological assessment results in rats 12 weeks after inducing sciatic nerve defects.
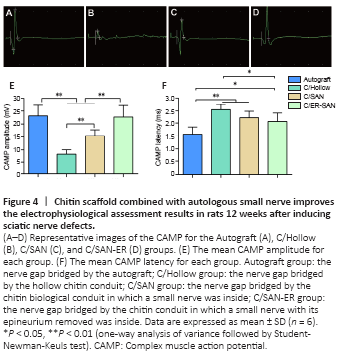
CAMP peak amplitudes and latencies were analyzed as part of the electrophysiological assessment of nerve conduction recovery. The CAMP peak amplitude is related to the number of innervated muscle fibers while the CAMP latency is affected by the thickness of the myelin sheath around the regenerated nerve and the degree of myelination (Lu et al., 2018). Representative CAMP curves from the four groups are shown in Figure 4A–D. CAMP amplitudes were significantly higher in the C/SAN and C/SAN-ER groups than in the Hollow group (P < 0.01). Moreover, the amplitude in the C/ER-SAN group was higher than that in the C/SAN group (P < 0.01) and similar to that of the Autograft group (Figure 4E). CAMP latency in the C/ER-SAN group was significantly lower than that in the C/Hollow group (P < 0.01) and significantly higher than that in the Autograft group (P < 0.05; Figure 4F).
Figure 5|Chitin scaffold combined with autologous small nerve affects the histology and weight of the gastrocnemius muscle in rats with sciatic nerve defects.
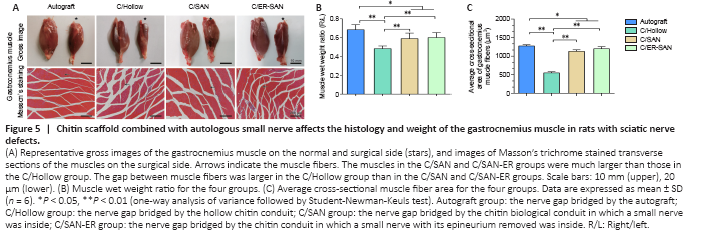
Gastrocnemius atrophy occurs after sciatic nerve transection and stops after reinnervation (Du et al., 2017). The degree of muscle atrophy was assessed 12 weeks after the operation to determine whether the denervated skeletal muscle could be re-innervated. Gross images of the gastrocnemius from both sides are shown in Figure 5A. Obviously atrophic muscles were observed in the C/Hollow group while attenuated muscle loss was found in the other groups. The wet weight ratios of the gastrocnemius in the C/SAN and C/SAN-ER groups were significantly higher than those in the C/Hollow group (P < 0.01), while still lower than that in the Autograft group (P < 0.05; Figure 5B).
Representative Masson’s stained images of muscles in the injured side are displayed in Figure 5A. Measurements of the mean cross-sectional area of muscle fibers further confirmed the more satisfying recovery in the C/SAN and C/SAN-ER groups relative to the C/Hollow group (P < 0.01; Figure 5C). However, the Autograft group made the best muscle recovery (P < 0.05; Figure 5B).
Figure 6|Chitin scaffold combined with autologous small nerve improves sciatic nerve regeneration in rats wit sciatic nerve defects.

HE and NF200/S100 immunofluorescence stain of the nerve grafts showed that the nerve fibers in all groups successfully regenerated through the nerve graft (Figure 6) with no inflammatory cell infiltration. However, double immunofluorescence staining indicated that the morphologic appearance was better in the Autograft, C/SAN, and C/SAN-ER groups than in the C/Hollow group (Figure 6A3–D3). Additionally, nerve tissue in the chitin scaffold was more evenly distributed and regeneration was stronger in the C/SAN and C/SAN-ER groups than in the C/Hollow group (Figure 6B3, C3, and D3).
Figure 7|Chitin scaffold combined with autologous small nerve affects the morphometric parameters of axonal regeneration in rats with sciatic nerve defects.
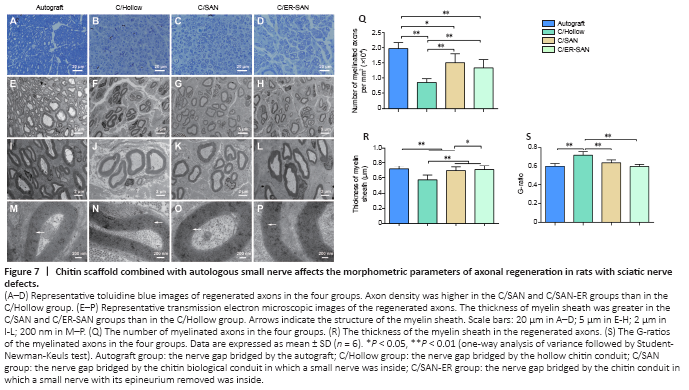
We quantified the density of regenerated axons by examining the semi-thin sections of regenerated nerve fibers that were dyed with toluidine blue. Axon density was greater in the C/SAN, C/SAN-ER, and Autograft groups than in the C/Hollow group (Figure 7A–D). We also quantified the number and density of axons within ultrathin sections that we observed using a transmission electron microscope (Figure 7E–P). The Autograft group had the highest number of regenerated axons, and axon density was again shown to be higher in the C/SAN and C/SAN-ER groups than in the C/Hollow group (P < 0.05; Figure 7Q).
Myelin sheath thickness, which is an index of nerve maturity (Maggipinto et al., 2017), was significantly greater in the Autograft and C/SAN-ER groups than that in the C/Hollow group (P < 0.01), but not significantly different from each other (P = 0.208; Figure 7R). The myelin sheath in the C/SAN group was significantly thicker than that in the C/Hollow group (P < 0.01), but thinner than what we observed in the Autograft and C/SAN-ER groups (P < 0.05; Figure 7R). Moreover, G-ratio measurement suggested that remyelination of the regenerated nerve fibers in the Autograft, C/SAN, and C/SAN-ER groups was better than that in the C/Hollow group (P < 0.05; Figure 7S).
Figure 8|Fluoro-gold (FG) retrograde labeled motoneurons and sensory neurons in the sciatic nerve of rats with chitin scaffold combined with autologous small nerve treatment.
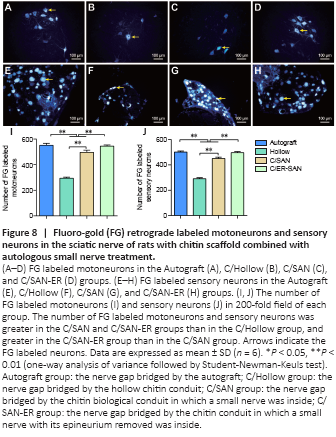
Retrograde staining of spinal motoneurons and dorsal root ganglia sensory neurons with FG can occur if new axons regenerate through the scaffolds successfully (Zhu et al., 2014). Representative FG labeled neurons are showed in Figure 8A–H. The number of stained neurons was similar between the C/SAN-ER and Autograft groups, and was significantly higher in these two groups than in the other groups (P < 0.01). The fewest number of FG labeled neurons was observed in the C/Hollow group (P < 0.01; Figure 8I and J).