周围神经损伤
-
Figure 1|Characterization of the BCS.
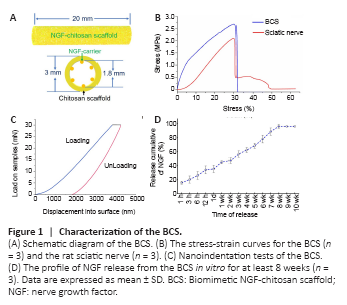
The total length of the NGF-chitosan scaffold used for transplantation was 20 mm. The inner diameter of the NGF-chitosan scaffold was 1.8 mm, the outer diameter was 3.0 mm, and the thickness of the tube wall was 0.6 mm (Figure 1A).
After our modification, the BCS has similar physical properties to the rat sciatic nerve (Figure 1B). The maximum stress withstood by the BCS was 2.656 ± 0.214 MPa and the maximum stress withstood by sciatic nerve was 2.094 ± 0.185 MPa (P < 0.05, n = 3). The elastic modulus was 9.692 ± 0.122 MPa for the BCS and 9.644 ± 0.228 MPa in normal sciatic nerves. In addition, breaking-point elongation was 32.1 ± 4.2% for the BCS and 31.8 ± 6.5% for the sciatic nerves. There was no difference in elastic modulus (P = 0.689, n = 3) and breaking elongation (P = 0.946, n = 3) between the two groups. This biomimetic elastic design might avoid any abnormal sensation caused by the scaffold around the sciatic nerve. Nanoindentation testing the BCS (Figure 1C), showed that the hardness at maximum load was 0.123 ± 0.044 GPa, the modulus at maximum load was 1.068 ± 0.164 GPa, and the displacement at maximum load was 4244.5 ± 511 nm. This indicated that the micromechanical properties of chitosan scaffolds also could deform quite a bit.
NGF was released at a rate of 15.7 ± 2.08% within the first 1 hour (Figure 1D). At 12 hours, total NGF release reached 34.0 ± 5.57%. This facilitated rapid deployment of large amounts of NGF in the microenvironment to promote nerve regeneration. At the following time point, NGF release began to slow, and by the 8th week, the total sustained release rate of NGF had reached 96 ± 2.65%. No release of NGF was detected at weeks 9 or 10. This indicates that the chitosan carrier could release NGF stably for 8 weeks, showing its potential to provide long-term nutritional support for repair of lengthy peripheral nerve injury.
Figure 2|General observation of the regenerated sciatic nerve 12 weeks after surgery.

Twelve weeks after surgery, the injured areas were observed in each group (Figure 2A and B). Macroscopic signs of neuroma formation, seroma, and inflammation were absent. In the SHAM group, the intact sciatic nerve was observed, while no significant sciatic nerve regeneration was observed in the LC group. No significant neural tissue regeneration was observed in the chitosan tube of the ET group. The nerve defect was successfully bridged by autologous nerve transplantation in the ANG group. The regenerated nerve tissue in the BCS group was able to bridge the 20-mm gap and showed normal peripheral nerve features. Thus, both BCS and ANG can be used to repair a 20-mm sciatic nerve defect in rats, but an empty tube alone failed to bridge the nerve defect (Figure 2C).
Figure 3|Sciatic nerve was successfully regenerated after BCS implant.

To observe the regenerated sciatic nerve in the BCS (Figure 3A), axons were labeled with NF200 antibody at 7 or 10 days after operation. Numerous regenerated axons were thus visible in the transverse sections of regenerated tissue (Figure 3B). Statistical analysis showed that the number of regenerated nerve fibers increased significantly between 7 and 10 days after operation in the BCS group (7 days: 1256.7 ± 54.0; 10 days: 723.3 ± 43.0; P < 0.001, n = 3; Figure 3C).
Twelve weeks after surgery, longitudinal section analysis showed that the regenerated nerves successfully bridged the 20-mm injured area. In the ANG and BCS groups, NF200+ regenerated nerve fibers were observed in the distal stump of the injured area (Additional Figure 1). Numerous axons and myelin sheaths were observed in the transverse sections (Figure 3D), and the microscopic structure of the myelin sheath around the axons could be observed in high magnification images (Figure 3E). In the BCS group, the chitosan carrier had been completely degraded and a large number of NF200 positive axons were found in the chitosan scaffold (Additional Figure 2). There was no significant difference in the number of regenerated axons between the ANG and BCS groups (ANG: 8605.3 ± 340.1; BCSS: 8546.5 ± 383.7; P = 0.859, n = 4; Figure 3F), but both were less than the total number of axons in the SHAM group (11729.5 ± 665.9, P < 0.001). In addition, observation of the myelin sheath via toluidine blue staining and transmission electron microscopy showed a large amount of regenerated myelin in the ANG and BCS groups (Additional Figure 3).
Figure 4|PRV-labeled motor and sensory neurons 12 weeks after surgery in the rats with sciatic nerve injury repaired with BCS.
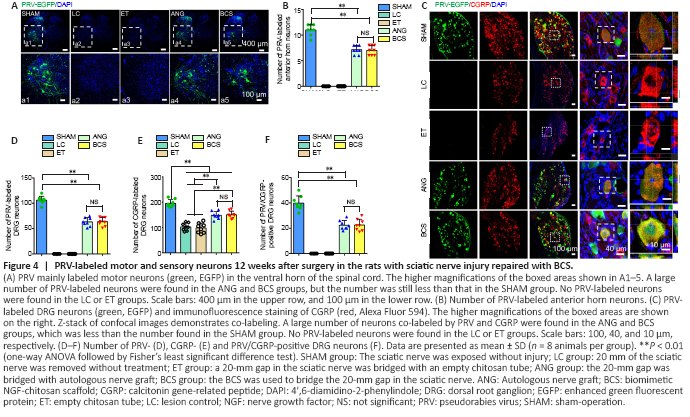
PRV-labeled motoneurons were observed in the L4 spinal cord of the SHAM group, ANG group, and BCS group (Figure 4A). We counted the number of PRV-labeled motor neurons, and found no significant difference between the ANG and BCS groups (ANG: 7.3 ± 0.9; BCS: 7.1 ± 1.1; P = 0.776, n = 8, Figure 4B). However, the number of PRV-labeled motoneurons was significantly lower in the ANG and BCS groups than in the SHAM group (SHAM: 11.1 ± 1.0, P < 0.001). The sciatic nerve is known to contain many sensory fibers that are directly connected to cell bodies located in the DRG (Dayawansa et al., 2016). We found that many DRG neurons were labeled in the SHAM, ANG and BCS groups (Figure 4C). The number of PRV-labeled DRG neurons was significantly lower in the BCS group than in the SHAM group (SHAM: 106.1 ± 7.8; BCS: 63.6 ± 8.4; P < 0.000, n = 8, Figure 4D). There was no significant difference between the BCS and ANG groups (BCS: 63.6 ± 8.4; ANG: 64.6 ± 10.2; P = 0.793, n = 8, Figure 4D). On this basis, we performed immunofluorescence staining for CGRP positive cells in the DRG. CGRP positive cells are mainly responsible for conducting nociceptive and temperature sensations (McCoy et al., 2013). We found many CGRP positive cells labeled in the DRG (Figure 4C and E). Many DRG cells were co-labeled with both CGRP and PRV in the ANG and BCS groups (Figure 4C and F).
Figure 5| PRV-labeled neurons in the brains of rats with sciatic nerve injury repaired via BCS.
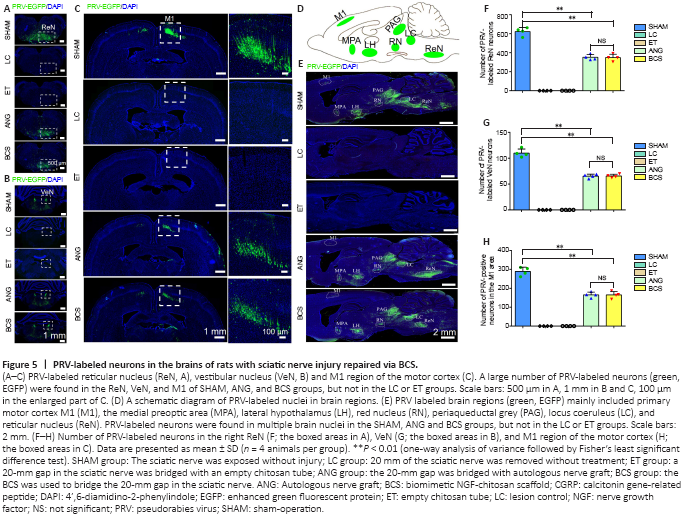
It is worth investigating whether the regenerated sciatic nerve established functional connections with the brain. Brain sections from the SHAM, ANG, and BCS groups showed that PRV-labeled neurons were mainly located in the reticular nucleus (Figure 5A), vestibular nucleus (Figure 5B), and cerebral cortex (Figure 5C). In addition, because of the transsynaptic ability of PRV and the complex connections between brain regions, PRV labeled neurons were also observed in the medial preoptic area, lateral hypothalamus, periaqueductal gray, red nucleus, and locus coeruleus (Figure 5D and E). However, no PRV labeled neurons were observed in the LC or ET groups. There was no statistically significant difference in the number of PRV-labeled neurons in the reticular nucleus (BCS: 354.6 ± 29.5; ANG: 347.8 ± 35.9; P = 0.779, n = 4), vestibular nucleus (BCS: 67.8 ± 2.2; ANG: 65.5 ± 3.4; P = 0.494, n = 4), and M1 region of motor cortex (BCS: 167.8 ± 18.9; ANG: 172.3 ± 24.0; P = 0.744, n = 4) between the BCS and ANG groups (Figure 5F–H). The number of PRV-labeled neurons in all three nuclei was lower in the ANG and BCS groups than in the SHAM group (all Ps < 0.01).
Figure 6|Behavioral motor and sensory functional recovery after sciatic nerve injury with BCS repair.
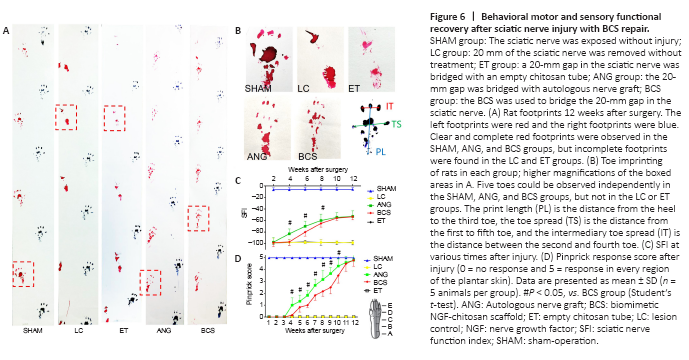
The left and right footprints of rats in each group were collected after surgery (Figure 6A and B). The SFI in the SHAM group remained close to –8.8 for the 12 weeks after surgery (Figure 6C), indicating that the motor function in this group was unaffected. From 1 to 12 weeks after operation, the SFI in the LC and ET groups remained around –100. In the ANG group, the SFI began to increase the 4th week after surgery, and continued to increase gradually through the 12th week. In the BCS group, the SFI began to increase the 6th week after surgery, and continued to increase gradually through the 12th week. Twelve weeks after surgery, the SFI did not differ between the ANG and BCS groups (ANG: –52.96 ± 6.29; BCS: –53.34 ± 5.02; P = 0.901, n = 5, Figure 6C). This suggests that with the passage of time, motor function in the BCS group gradually recovered to the same levels as are achieved with an autogenous nerve graft.
We used a pinprick assay to evaluate the recovery of sensory function in the plantar skin of each group (Figure 6D). The five response areas (from A to E) in the SHAM group responded quickly and forcefully to the pinprick, resulting in a pinprick score of 5 (Sakuma et al., 2016). In the LC and ET groups, the pinprick score was 0 throughout the experimental period. At the 4th week after surgery, one of the five reaction areas of the injured foot in the ANG group began to respond to the pinprick. Over weeks 4 to 12, the number of areas that responded gradually increased. Results were similar in the BCS group, with initial responses in one area beginning at the 5th week after surgery. At the 12th week, all designated areas of the injured foot in the BCS group responded to the pinprick.
Figure 7|Atrophy of the anterior tibia muscle 12 weeks after the sciatic nerve injury and BCS repair.
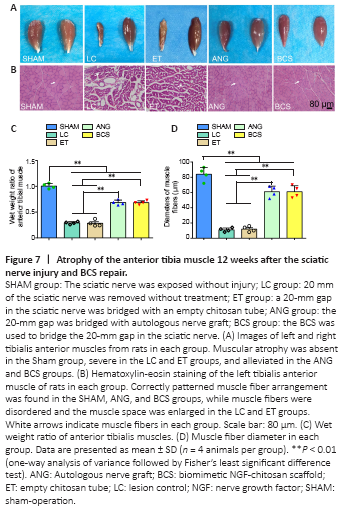
Twelve weeks after surgery, we removed the left and right tibialis anterior muscles from rats in each group (Figure 7A). Atrophy of the muscle on the injured side was severe in the LC and ET groups. Tibialis anterior atrophy also appeared in rats from the ANG and BCS groups, but was less than in the groups that were not treated (Figure 7C). The muscle wet weight ratio for the BCS group was significantly worse than that of the SHAM group (BCS: 0.684 ± 0.036; SHAM: 1.005 ± 0.049; P < 0.01, n = 4, Figure 7C), but better than those of the LC (0.292 ± 0.025, P < 0.01) and ET groups (0.285 ± 0.061, P < 0.01). There was no significant difference in muscle wet weight ratio between the ANG and BCS groups (BCS: 0.684 ± 0.036; ANG: 0.708 ± 0.068; P = 0.497, n = 4, Figure 7C). Next, HE staining was performed on the transverse section of the left tibialis anterior muscle to observe changes in muscle fiber diameter (Figure 7B). The diameters of muscle fibers in the SHAM, LC, and ET groups were 84.0 ± 8.98, 11.0 ± 2.58 and 12.0 ± 3.65 μm, respectively. There was no significant difference between the ANG and BCS groups (ANG: 63.5 ± 7.72 μm; BCS: 61.0 ± 7.87 μm; P = 0.604, n = 4, Figure 7D). The muscle fiber diameter in both groups was significantly larger than what was observed in the LC or ET groups (P < 0.01), but significantly smaller than that of the SHAM group (P < 0.01). These results indicate that wet muscle weight is maintained, and muscle fiber diameter is larger in the ANG and BCS groups than in untreated rats, thus reducing muscular atrophy.
Figure 8|Reconstruction of motor end plates 12 weeks after sciatic nerve injury and BCS repair.
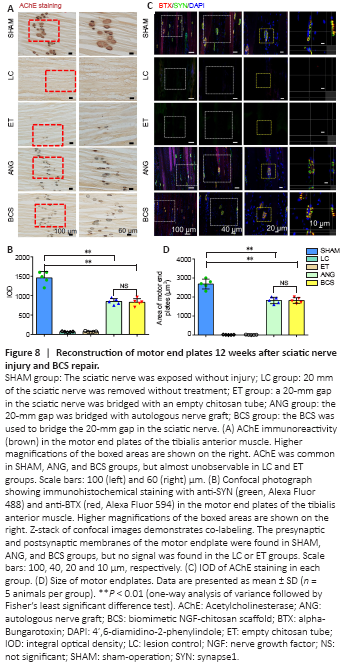
Twelve weeks after surgery, stained AChE was brown, smooth edged, and had a clear structure in the SHAM group (Figure 8A). In the LC and ET groups, stained AChE was only observed occasionally. In the ANG and BCS groups, stained AChE was numerous, indicating the recovery of AChE activity. There was no significant difference in the IOD of AChE staining between the two groups (ANG: 848.6 ± 79.1; BCS: 829.2 ± 93.7; P = 0.745, n = 5, Figure 8B), but it was less for both than for the SHAM group (1457.8 ± 166.7, P < 0.01).
To detect the remodeling of motor endplates in the rats, sections of the left tibialis anterior muscle were stained with SYN and BTX and analyzed for immunofluorescence. In the SHAM group, clear motor endplate structures were observed, including SYN+ presynaptic membranes and BTX+ postsynaptic membranes (Figure 8C). Similarly, numerous marked motor endplates were observed in the ANG and BCS groups. In contrast, the structures were rarely observed in the presynaptic and post-synaptic membranes of the LC and ET groups, indicating a severe loss of motor function. There was no significant difference in the reconstructed motor endplate areas between the ANG and BCS groups (ANG: 2018.0 ± 347.2 μm2; BCS: 1812.2 ± 148.6 μm2; P = 0.128, n = 5, Figure 8D), but both areas were smaller than what was seen in the SHAM group (2679.6 ± 258.8 μm2, P < 0.01). This suggests that regenerated nerves and muscles can help rebuild the motor endplate, thus restoring the contractive function of muscles.