脑损伤
-
Figure 2|Change in HAMD-24 scores at 0, 4, and 6 weeks in the LBP and placebo groups.

The total HAMD-24 scores based on estimated marginal means at baseline, week 4, and week 6 are displayed in Figure 2. The difference between the groups gradually increased over the 6-week interval. At the study endpoint (week 6), the estimated group difference in HAMD-24 score between the placebo and the LBP (placebo minus LBP) group was 3.149 (95% CI: 0.675–5.710; F = 6.374; P = 0.014; Cohen’s d = 0.860), indicating a greater decrease in depressive symptoms in the LBP group.
Figure 3|Change in assessment scores from baseline to 6 weeks in the LBP and placebo groups.
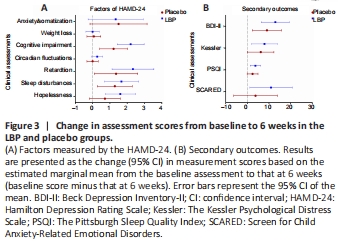
As for the factors measured by the HAMD-24 (Figure 3A), we found significant changes in cognitive impairment, retardation, and sleep disturbances in both groups between the baseline assessment and week 6. For those in the placebo group, these reductions in score were 1.214 (95% CI: 0.411–2.017; P < 0.01), 1.357 (95% CI: 0.105–2.609; P = 0.029), and 1.286 (95% CI: 0.277–2.295; P < 0.01), respectively. The estimated reductions in the LBP group were 2.2 (95% CI: 1.424–2.976; P < 0.01), 2.333 (95% CI: 1.124–3.543; P < 0.01), and 1.667 (95% CI: 0.692–2.641; P < 0.01), respectively. The factor of hopelessness significantly decreased by 1.6 (95% CI: 0.739–2.461; P < 0.01) from the baseline assessment to week 6 in the LBP group. At week 6, compared with the placebo group, the LBP group exhibited a greater reduction in cognitive impairment (group difference: 0.895; 95% CI: 0.251–1.539; F = 7.663; P = 0.007; Cohen’s d = 0.879), retardation (group difference: 1.085; 95% CI: 0.081–2.089; F = 4.628; P = 0.035; Cohen’s d = 0.82), and hopelessness (group difference: 0.814; 95% CI: 0.097–1.53; F = 5.111; P = 0.027; Cohen’s d = 0.832) (Table 2).
In the LBP group, the PSQI and SCARED scores were significantly reduced to 3.733 (95% CI: 1.308–6.159; P < 0.01) and 10.953 (95% CI: 1.186–20.720; P < 0.05), respectively (Figure 3B).