脑损伤
-
Figure 2|Changes in levels of necroptosis markers within the periventricular tissue after IVH induction.
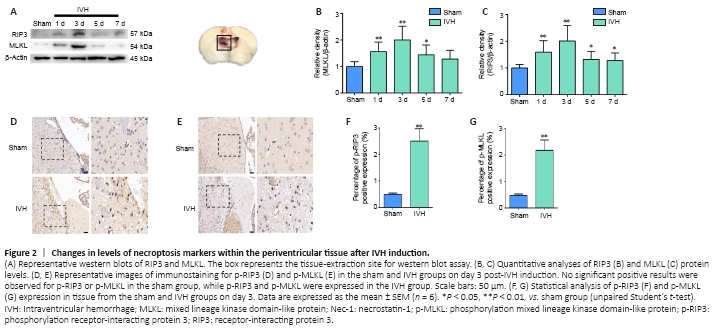
We established a mouse IVH model by injecting 50 μL of autologous blood into the ventricles to investigate whether necroptosis occurred after IVH induction (Figure 1A). Brain tissue sections demonstrated that blood was present in the lateral ventricles at all levels, and the blood was observed in the gap between the hippocampus and corpus callosum (Figure 1B). T2-weighted MRI images revealed that low signals were present in the lateral ventricles 1 day after IVH induction (Figure 1C). Furthermore, we chose days 1, 3, 5, and 7 after IVH modeling as the time points to observe changes in expression of the necroptosis markers RIP3 and MLKL. Western blots showed that the expression of RIP3 and MLKL in the periventricular tissues was highest on day 3 after IVH modeling compared with expression in the sham group (P < 0.01; Figure 2A–C). In addition, immunohistochemistry demonstrated that positive staining for p-RIP3 and p-MLKL within the periventricular tissues increased by day 3 after IVH induction compared with that in the sham group (P < 0.01; Figure 2D–G). These results indicated that necroptosis occurred in the area of the lateral ventricle after IVH was induced and was predominant on day 3 after IVH modeling.
Figure 3|Immunofluorescent staining for the necroptosis markers p-RIP3 and p-MLKL in the periventricular tissue on day 3 after IVH.
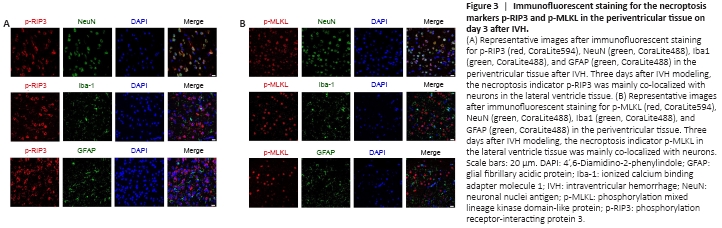
To determine the cellular localization of activated RIP3 and MLKL 3 days after IVH induction, we used immunofluorescence to observe which types of cells expressed p-RIP3 and p-MLKL. We found that the necroptosis markers p-RIP3 and p-MLKL were mainly expressed in neurons and rarely co-localized with astrocytes or microglia after IVH modeling (Figure 3A and B, respectively).
Figure 4|Effects of necrostatin-1 on the expression of necroptosis markers in periventricular tissue 3 days after IVH induction.
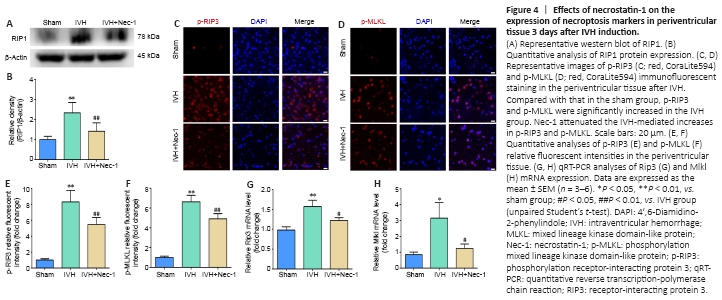
We found that RIP1 expression increased after IVH (P < 0.01, vs. sham group), and the expression level of RIP1 in the IVH + Nec-1 group was lower than that in the IVH group (P < 0.01; Figure 4A and B). Moreover, we used immunofluorescent staining and qRT-PCR to determine the effect of Nec-1 on necroptosis after IVH. The fluorescence intensity for p-RIP3 and p-MLKL and the mRNA expression of Rip3 and Mlkl were upregulated in the IVH group (P < 0.05 vs. sham group), but the addition of Nec-1 attenuated these changes (P < 0.05 or P < 0.01, vs. IVH group; Figure 4C–H).
Figure 5| Effects of necrostatin-1 on necrotic cell death and pathological damage in the periventricular tissue on day 3 after IVH induction.
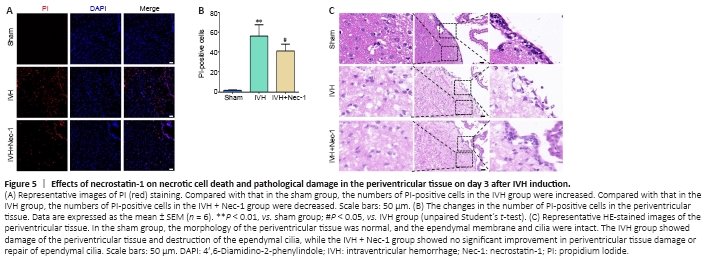
The number of PI-positive cells in the periventricular tissue from mice in the IVH group increased compared with that in the sham group (P < 0.01). Pretreatment with Nec-1 reduced the number of PI-positive cells compared with that in the IVH only group (P < 0.05; Figure 5A and B). The HE staining results showed ependymal wall disruption and cell denudation in the tissue from the IVH group, and there were almost no intact ependymal cilia by general observation. Nec-1 treatment did not significantly alleviate periventricular injury or damage to ependymal cilia induced by IVH (Figure 5C).
Figure 6| Effects of necrostatin-1 on microglial activation and inflammation around the lateral ventricle after IVH induction.
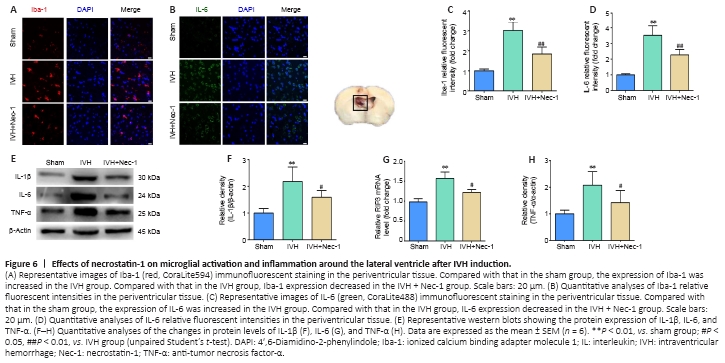
Changes in microglia levels were observed with immunofluorescent staining. The numbers of Iba1-positive cells were increased in the area of the lateral ventricles after IVH induction compared with that in the sham group. Moreover, fewer Iba1-positive cells were noted around the lateral ventricle in the IVH + Nec-1 group than that in the IVH group (P < 0.01; Figure 6A and B). In addition, we selected IL-1β, IL-6, and TNF-α as markers to assess the effect of Nec-1 on inflammatory factors after IVH. Immunofluorescent staining of IL-6 was performed to determine whether Nec-1 demonstrated an anti-neuroinflammatory effect after IVH. While the relative fluorescent intensity of IL-6 was increased after IVH induction, Nec-1 treatment partially reversed this effect (P < 0.01, vs. IVH group; Figure 6C and D). Western blots showed that the expression of the three inflammatory factors was increased in the IVH group compared with that in the sham group (P < 0.01), and Nec-1 treatment attenuated the expression of these inflammatory markers (P < 0.05, vs. IVH group; Figure 6E–H).
Figure 7| Effects of necrostatin-1 on hydrocephalus after IVH induction.
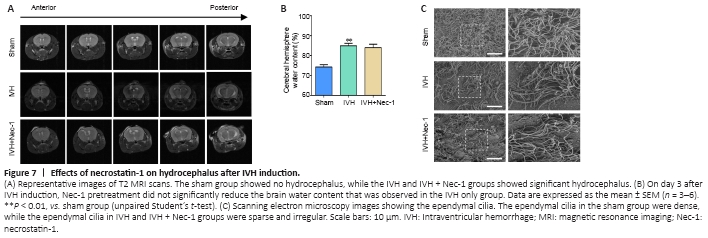
We found that there was obvious hydrocephalus 3 days after IVH modeling by using T2-weighted MRI. However, Nec-1 treatment did not reduce the degree of hydrocephalus (Figure 7A). In addition, we found that Nec-1 treatment did not significantly reduce water content in the brains when compared with that in the IVH only group (Figure 7B). Injury to the ependymal cilia is closely associated with the development of hydrocephalus. We observed the ependymal cilia using scanning electron microscopy. In the IVH group, the ependymal cilia were kinked, disorganized, and there was progressive loss. Nec-1 treatment did not reverse this effect (Figure 7C). Collectively, these results suggested that inhibiting necroptosis in the early stage after IVH may have a limited effect on the formation of secondary hydrocephalus.