周围神经损伤
-
Figure 1|Morphological observations of prepared CHGF composite nerve conduits.
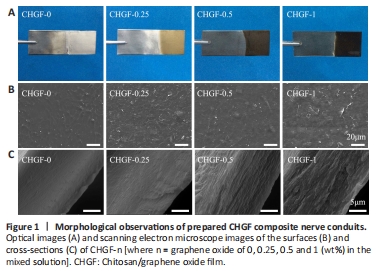
Optical images of CHGF-n are shown in Figure 1A. It was observed that CHGF-0 was transparent, while CHGF-0.25, CHGF-0.5, and CHGF-1 appeared light brown, dark brown, and black, respectively. These results confirmed that GO was successfully electrodeposited together with CH. Next, the microstructure of CHGF-n was observed by SEM. As shown in Figure 1B, CHGF-0 exhibited a rough surface morphology. Compared with CHGF-0, CHGF-0.25 exhibited the typical crumpled and wrinkled texture associated with the presence of flexible and ultrathin graphene flakes (Liu et al., 2013). These flakes were evenly distributed among the film surface, providing physical cues for cell adhesion growth. In addition, several studies documented that GO could be used as chemical cue to enhance nerve cell growth and neurite extension (Liu et al., 2017). However, the surface changed as the GO content increased, with CHGF-0.5 exhibiting flake-like structures and CHGF-1 exhibiting a relatively smooth surface, potentially caused by GO accumulation. Figure 1C displays SEM images of CHGF-n cross-sections. The cross-section structure of CHGF-0 was observed to be smooth. When the addition of GO, uniform flake-like structures appeared on the cross-section of CHGF-0.25. This flake-like structure was replace by a more obvious multilayered structure in CHGF-0.5. However, the multilayered structure appeared slightly deteriorated in CHGF-1, likely owing to the excessive GO added to CS during the electrodeposition process. Conclusively, GO could be evenly dispersed within the CH film and the structure of deposited CHGF-n was influenced by the proportion of GO.
Figure 3|CH/GO composite nerve conduits exhibited excellent biocompatibility towards SCs in vitro.
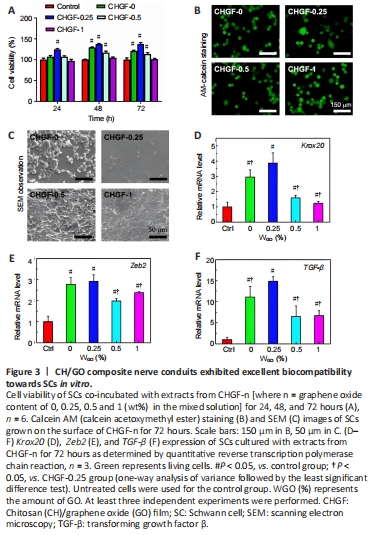
As shown in Figure 3A, the activity of SCs on CHGF-0.25 was highest at 24 hours, but decreased on CHGF-0.5 and CHGF-1, consistent with the notion that GO has dose-cytotoxicity. At 48 hours, the cell activity of each group was higher compared with that at 24 hours, and cell activity on CHGF-0.25 remained the highest. At 72 hours, cell activities on CHGF-0, CHGF-0.5, and CHGF-1 began to decrease. However, CHGF-0.25 retained a remarkable increase of cell viability compared with the control group. These results clearly suggest that cell viability depended on GO content and cell culture duration, and the excellent cytocompatibility of CHGF-0.25 makes it a promising material to construct CHGFC for peripheral tissue engineering applications.
Figure 3C shows SEM images of SCs on CHGF-n. Cells cultured on the CHGF-0, CHGF-0.5, and CHGF-1 were round and clustered together, which may be caused by the hydrophobic surface, microstructure, and chemical composition of these three samples. Cells cultured on CHGF-0.25 were well spread out and exhibited long spindle shapes, possibly due to its hydrophilic characteristics. SCs were further characterized by immunofluorescence staining. As shown in Figure 3B, in contrast to cells on other samples, cells cultured on CHGF-0.25 had spindle shapes. Therefore, samples with a GO content of 0.25% were identified as the favorable cell carrier to promote the spread and growth of SCs.
As shown in Figure 3D–F, mRNA expression levels of Krox20, TGF-β, and Zeb2 in all CHGF-n groups were remarkably higher compared with the control group. Additionally, mRNA expression levels were relatively increased in the CHGF-0.25 group. Conclusively, CHGF-n, especially CHGF-0.25, promoted expression of nerve-related factors such as Krox20, Zeb2 and TGF-β, thus ensuring the regeneration of damaged nerves. Collectively, the results described above show that CHGF-0.25 had the most suitable surface structure, mechanical properties, and cell compatibility for SC growth, and the best performance for nerve-related factor secretion. Thus, the conduit referred to as CHGFC-0.25 (based on CHGF-0.25) was selected for animal experiments to evaluate nerve repair effects. CHGFC-0 and autograft groups were used as controls.
Figure 5|Histology of sciatic nerve 90 days after transplantation.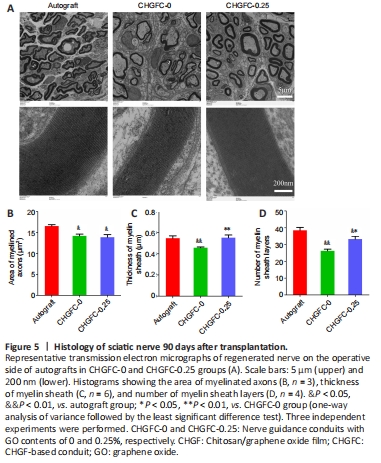
As shown in Figure 5A, regenerated myelinated fibers were scattered in clusters (with the exception of an occasional unmyelinated fiber) and myelinated axons were coated with a clear myelin sheath in the autograft group. Structures of myelinated fibers in the CHGFC-0.25 group were similar to those of the autograft group. In contrast, myelinated fibers were seldom observed in the CHGFC-0 group. Areas of myelinated axons, thicknesses of myelin sheaths, and numbers of myelin sheath layers were significantly decreased in the CHGFC-0 group compared with the autograft group (P < 0.05 or P < 0.01; Figure 5B–D), while thicknesses of myelin sheaths and numbers of myelin sheath layers were significantly increased the CHGFC-25 group compared with the CHGFC-0 group (P < 0.01 and P < 0.05). Regenerated nerves in the CHGFC-0.25 group showed better recovery compared with the CHGFC-0 group but remained inferior to the autograft group.
Figure 6|CHGFC-0.25 promoted gastrocnemius muscle regeneration.
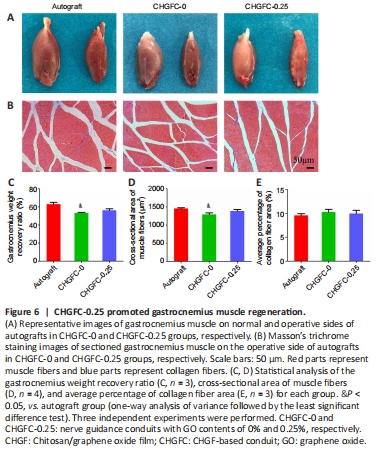
As displayed in Figure 6A and B, gastrocnemius muscle dystrophy on the operative side of the CHGFC-0 group was more obvious compared with that of the autograft group. Results shown in Figure 6C–E indicate that muscle recovery of the CHGFC-0 group was worse compared with the autograft group, while muscle recovery of the CHGFC-0.25 group was similar to that of the autograft group.