脑损伤
-
Figure 1|VNS upregulates α7nAchR expression in the ischemic penumbra after cerebral I/R injury.
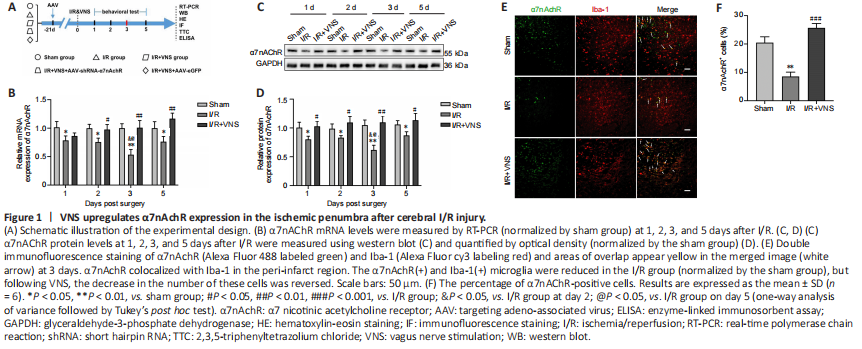
α7nAchR expression was evaluated 1, 2, 3, and 5 days after MCAO. Our results showed that α7nAchR mRNA and protein expression levels in the ischemic penumbra were lower than those in the sham group, especially on day 3 (both P < 0.01, respectively; I/R group vs. sham group; Figure 1B–D). However, VNS reversed the reduction in α7nAchR expression caused by I/R injury, and α7nAchR expression gradually reached normal levels after VNS (both P < 0.01; I/R + VNS group vs. I/R group; Figure 1B–D). On day 3 after cerebral I/R was the key time point for microglial transformation from the pro-inflammatory phenotype to the regulatory phenotype (Ma et al., 2019). Thus, we chose day 3 after reperfusion as the time point of interest for subsequent experiments. To further explore the cellular localization of α7nAchR in the central nervous system, we performed double immunofluorescence staining, and the results suggested that α7nAchR was colocalized with Iba-1, a marker of microglia (Figure 1E). The immunofluorescence results suggested that the percentage of α7nAchR+ cells was decreased after I/R compared with that in the sham group (P < 0.01; I/R group vs. sham group), but this decline in the cell number in the I/R group was attenuated following VNS (P < 0.001; I/R + VNS group vs. I/R group; Figure 1F).
Figure 2|VNS attenuates brain injury and improves neurological outcomes after cerebral I/R injury via an α7nAChR-dependent pathway.

To verify the role of α7nAchR in VNS-induced neuroprotective effects, an α7nAchR-targeting AAV-shRNA was directly injected into the lateral ventricles 3 weeks before MCAO. α7nAchR knockdown efficiency was confirmed by western blot assay (P < 0.001; AAV-shRNA α7nAchR group vs. AAV-eGFP group; Figure 2A and B). The 2,3,5-triphenyltetrazolium chloride staining results indicated that VNS significantly reduced the infarct volume on day 3 after MCAO compared with that in the I/R group (P < 0.01; I/R + VNS group vs. I/R
group; Figure 2C and D). However, the effects of VNS were inhibited by knockdown of α7nAchR compared with that in the I/R + VNS group (P < 0.01; I/R + VNS + AAV-shRNA-α7nAchR group vs. I/R + VNS group; Figure 2C and D). The modified neurologic severity score assessment and the rotarod test were conducted before MCAO and again 1, 2, 3, and 5 days after MCAO to determine neurological function recovery. Our results showed that the I/R + VNS group outperformed the model group in terms of neurological scores at all time points after perfusion compared with that in the I/R group (all P < 0.05, I/R + VNS group vs. I/R group; Figure 2E and F). However, injection of AAV-shRNA-α7nAchR drastically attenuated the improvement of VNS on neurological function at the same time point compared with that in the I/R + VNS group (all P < 0.05, I/R + VNS + AAV-shRNA-α7nAchR group vs. I/R + VNS group; Figure 2E and F).
For hematoxylin-eosin staining, brain cells were swollen and nuclei were condensed and vacuolized in the I/R group compared with that in the sham group. Following VNS, inflammatory cell infiltration and neuronal necrosis were dramatically alleviated. AAV-shRNA-α7nAchR was also found to counteract the beneficial effects of VNS, as shown by an increasing number of condensed nuclei, intense staining, and shrinkage (Figure 2G). On the basis of these results, we hypothesized that VNS exerts neuroprotection against cerebral I/R injury through α7nAchR.
Figure 3|VNS promotes the microglial regulatory phenotype through α7nAchR after cerebral I/R injury.
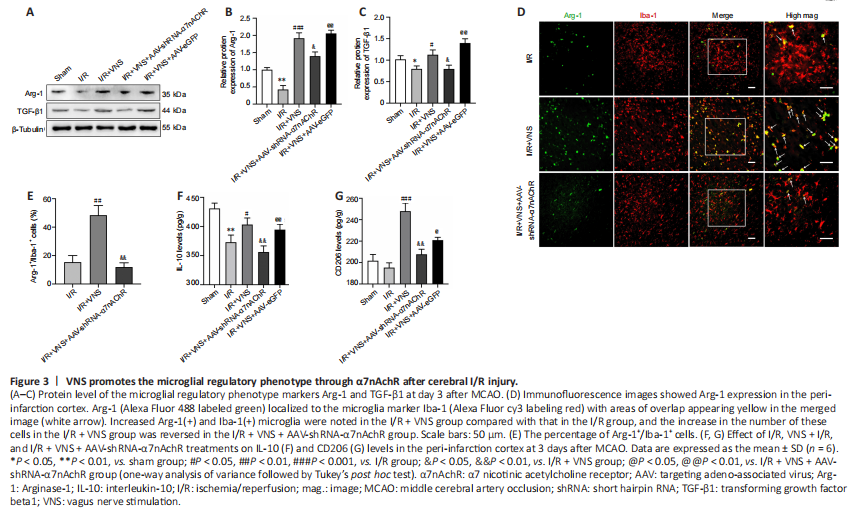
Western blot results showed that the levels of regulatory phenotype markers (Arg-1 and TGF-β1) were notably increased after VNS treatment compared with that in the I/R group (Arg-1, P < 0.001; TGF-β1, P < 0.05; I/R + VNS group vs. I/R group; Figure 3A–C). However, the aforementioned effects of VNS on the change in the microglial phenotype were attenuated after α7nAchR knockdown compared with that in the I/R + VNS group (Arg-1, P < 0.05; TGF-β1, P < 0.05; I/R + VNS + AAV-shRNA-α7nAchR group vs. I/R + VNS group; Figure 3A–C). Immunofluorescence staining of microglia in the cerebral cortex further indicated that VNS exerted a protective effect. Immunofluorescence analysis of the ischemic penumbral brain tissue indicated that VNS increased the Arg-1+/Iba-1+ microglial density compared with that in the I/R group (P < 0.01; I/R + VNS group vs. I/R group; Figure 3D and E). The effect of VNS on the Arg-1+/Iba-1+ cell density in the ischemic penumbra was abolished after inhibition of α7nAchR compared with that in the I/R + VNS group (P < 0.01; I/R
+ VNS + AAV-shRNA-α7nAchR group vs. I/R + VNS group; Figure 3D and E).
ELISA was used to assess changes in inflammatory cytokines and specific microglial markers. VNS increased IL-10 and CD206 expression levels compared with those in the I/R group (IL-10, P < 0.05; CD206, P < 0.001; I/R + VNS group vs. I/R group; Figure 3F and G). Compared with that in VNS, α7nAchR inhibition attenuated the VNS-mediated regulatory microglial phenotype after MCAO (IL-10, P < 0.01; CD206, P < 0.01; I/R + VNS + AAV-shRNA-α7nAchR group vs. I/R + VNS group; Figure 3F and G).
Figure 4|VNS inhibits the pro-inflammatory phenotype of microglia through α7nAchR after cerebral I/R injury.
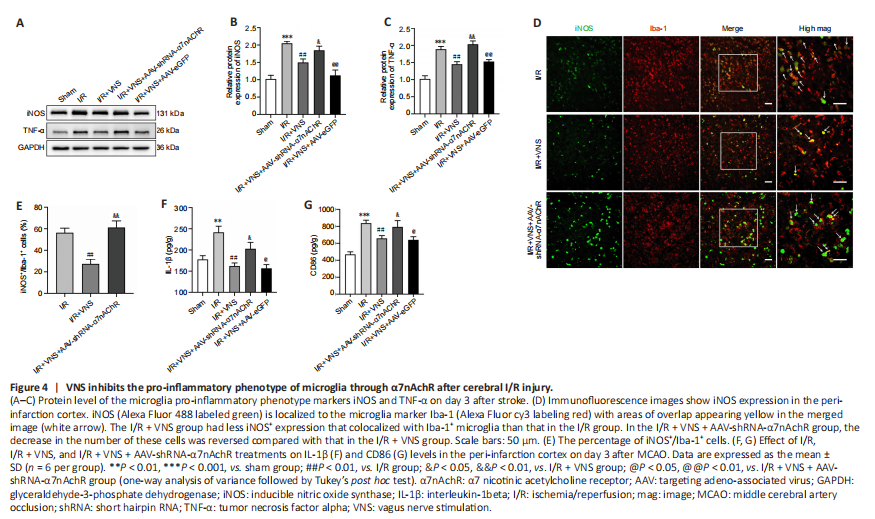
The pro-inflammatory microglial phenotype was also assessed on day 3 after MCAO. Western blot results revealed that VNS reduced the expression of pro-inflammatory phenotype markers iNOS and TNF-α (iNOS, P < 0.01; TNF-α, P < 0.01; I/R + VNS group vs. I/R group; Figure 4A–C). However, lateral ventricle injection of AAV-shRNA-α7nAchR considerably upregulated iNOS and TNF-α expression (iNOS, P < 0.05; TNF-α, P < 0.01; I/R + VNS + AAV-shRNA-α7nAchR group vs. I/R + VNS group; Figure 4A–C). Similarly, immunofluorescence staining suggested that knockdown of α7nAchR abolished the beneficial effect of VNS on the density of iNOS+/Iba-1+ (P < 0.01; I/R + VNS + AAV-shRNA-α7nAchR group vs. I/R + VNS group; Figure 4D and E). Additionally, the IL-1β and CD86 levels were significantly decreased after VNS compared with that in the I/R group (IL-1β, P < 0.01; CD86, P < 0.01; I/R + VNS group vs. I/R group). However, this trend was reversed considerably through AAV-shRNA-α7nAchR injection (IL-1β, P < 0.05; CD86, P < 0.05; I/R + VNS + AAV-shRNA-α7nAchR group vs. I/R + VNS group; Figure 4F and G).