视神经损伤
-
Figure 1|AAV7m8 GFAP::GFP-ND1 converts a limited number of Müller cells into inner retinal neurons.
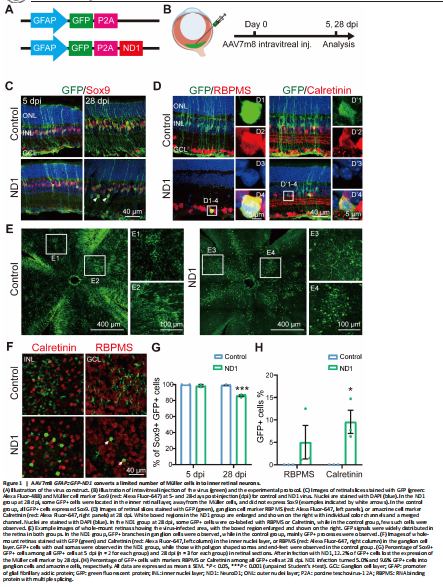
To test whether ND1 can convert retinal Müller glial cells into neurons, we first intravitreally injected AAV7m8 GFAP::GFP-ND1 or a control virus expressing GFP alone (AAV7m8 GFAP::GFP) into the eyes of the mice (Figure 1A). At 5- or 28-days post-injection (dpi), we stained the retinas for glial and neuronal markers (Figure 1B, experimental protocol illustrated). At 5 dpi, for both control and ND1 groups, essentially all GFP+ cells expressed glial cell marker Sox9 in the Müller cell layer (Figure 1C, left column), confirming the specific infection of Müller glial cells by our AAV. At 28 dpi, all GFP+ cells in the control group still had the typical morphology of Müller cells, with long processes expanding through the whole retina, and cell somas expressing Sox9 (Figure 1C, top right panel). In contrast, although the majority of GFP+ cells in the ND1 group were still Sox9+ (i.e., Müller glia) at 28 dpi, a small percentage of them were not and were located away from the Müller glia layer (Figure 1C, bottom right panel, white arrows). Because all GFP+ cells were initially Sox9+ Müller glia, the fact that some cells stopped expressing Sox9 suggested that they might start to change their identity. To determine whether these observed changes were due to a change in cell type from glia to neuron, we performed immunostaining for markers of inner retinal neurons. In ND1 group at 28 dpi, we identified a few GFP+ cells in the GCL expressing ganglion cell marker RBPMS (Figure 1D, D1 to D4 showing an enlarged cell in ND1 group). We also identified GFP+ cells in the INL expressing amacrine cell marker Calretinin (Figure 1D, D’1 to D’4 showing an enlarged cell in ND1 group).
Examination of whole-mount retinas also revealed differences between the control group and the ND1 group (Figure 1E and F). At 28 dpi, GFP+ cells were spread out and covered a large area of retina, with cells in the control group being more densely infected than those in the ND1 group. Numerous GFP+ Müller cell processes and somas with polygon shapes were seen in the control group (Figure 1E1 and E2), while GFP+ branches of typical RGC dendrites and somas with round or octal shape were observed in ND1 group (Figure 1E3 and E4). Scanning the whole-mount retinas from the INL to the GCL further revealed polygon shaped soma and end-feet processes in the control group (Figure 1F top row), but oval or round shaped somas in the ND1 group, which were similar to the somas of neighboring neurons (Figure 1F bottom row). Quantified data indicated that in the control group, the percentage of Sox9+GFP+ double-positive cells among all the GFP+ cells was nearly 100% from 5 dpi to 28 dpi (blue bars in Figure 1G), indicating that our AAV vectors are highly specific for Müller cells. In contrast, in the ND1 group, the percentage of these double-positive cells dropped from nearly 100% at 5 dpi to 86% at 28 dpi (green bars in Figure 1G), indicating that some GFP+ cells infected by ND1 gradually lost this characteristic of Müller cells. However, the total number of Sox9+ cells was similar between ND1 and control groups, ranging from 27–39 per image at both 5 dpi and 28 dpi.
The drop in the percentage of cells with Müller-cell markers in the ND1 group was similar to the increase in the percentage of markers for inner retinal neurons (Figure 1H, 5.0% GFP+ RBPMS+ double-positive cells, and 9.6% GFP+ Calretinin+ double-positive cells). Similarly, in whole-mount retinas from ND1-group at 28 dpi, we found that 11.6% of cells showed neuron morphology in the INL and 6.8% showed neuron morphology in the GCL layer. Thus, we can conclude that intravitreal injection of AAV7m8 GFAP::GFP-ND1 converted Müller cells into inner retinal neurons, with limited conversion efficiency.
Figure 2|Müller glia are converted into amacrine cells by ND1 in NMDA injured retina.
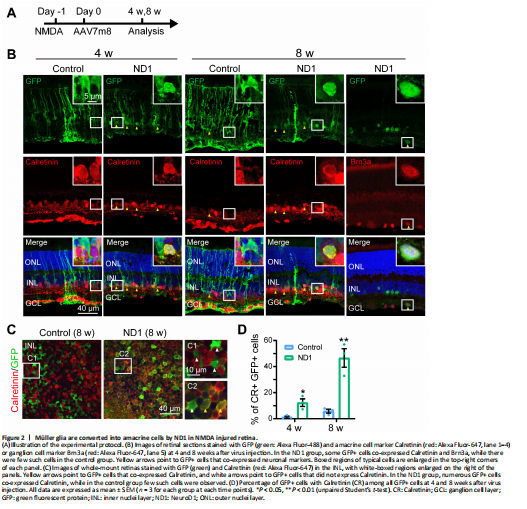
In a previous study, zebrafish Müller cells were transformed into ganglion cells in a model of ganglion cell damage, and into photoreceptors in a model of photoreceptor cell injury (Nagashima et al., 2013), suggesting that injury is a factor for stimulating neural regeneration. Therefore, we investigated whether Müller cells can be converted more efficiently in an injury model. To test this idea, we induced retinal cell death via intravitreal injection of NMDA one day before AAV infection, and then examined the AAV7m8-infected cells 4 and 8 weeks later (protocol shown in Figure 2A). We discovered that in the control group, at both 4 and 8 weeks after virus injection, most GFP+ cells remained Müller cells with typical Müller cell morphology (Figure 2B, left column, typical morphology enlarged in the inset), with very few in the IPL expressing the amacrine cell marker Calretinin (yellow arrowhead in Figure 2B, 8 weeks, left column). However, in the ND1 group, some GFP+ cells appeared as the inner retinal neurons at 4 weeks after virus injection and co-expressed Calretinin (yellow arrowheads in Figure 2B, 4 weeks, right column). By 8 weeks, the majority of ND1-infected cells displayed neuronal morphology and expressed Calretinin (Figure 2B, 8 weeks, middle column) or the ganglion cell marker Brn3a (Figure 2B, 8 weeks, right column). Some GFP+ cells remained typically Müller, with polygon shaped somas and long-extending processes. The reprogramming effect was even more striking when we examined the whole-mount retinas of virally infected regions. In the control group, the somas of GFP+ cells were inlaid nicely between Calretinin+ somas in the INL (Figure 2C left panel, white arrowheads in the enlarged C1 inset). In contrast, in the ND1 group, many GFP+ cell somas were overlaid with Calretinin+ somas, indicating a successful reprogramming by ND1 (Figure 2C, right panel, yellow arrowheads in the enlarged C2 inset). Quantitative analysis revealed that in the retinal section of the NMDA injury model, ND1 converted Müller cells into Calretinin+ amacrine cells with a conversion efficiency of 12.3 ± 2.9% (4 weeks) and 46.6 ± 7.1% (8 weeks) (n = 3 mice each), compared with 1.2 ± 0.8% (4 weeks) and 5.8 ± 1.5% (8 weeks) in the control group (n = 3 mice each) (Figure 2D). Therefore, our data indicate that ND1 can reprogram Müller cells into inner retinal neurons in the NMDA-injured mouse retina, and the efficiency was greater than in non-injured retinas (9.6% at 4 weeks after ND1 injection).
Figure 3|AAV9 GFAP104::ND1-GFP enhances the expression of ND1.
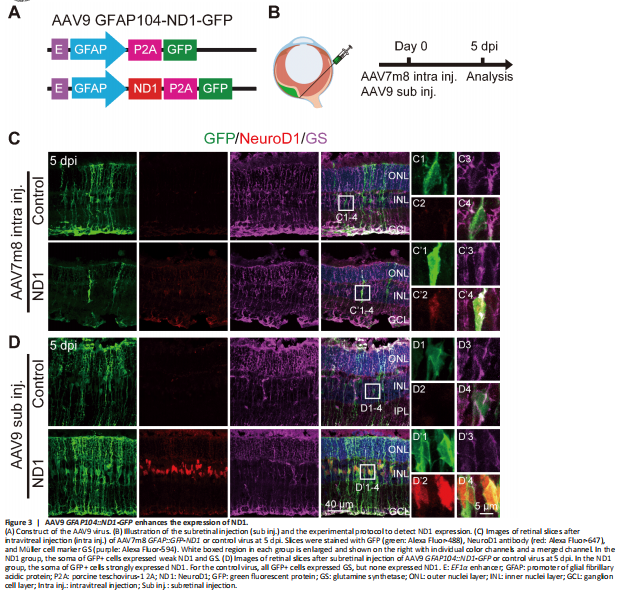
Because conversion efficiency among viral infected Müller cells after intravitreal injection of AAV7m8 GFP-ND1 was low, we examined ND1 expression level via immunostaining. Surprisingly, we could barely detect ND1 signals in the ND1-infected cells, even though GFP signals were obvious. This might have occurred for several reasons. For instance, maybe it was because the AAV serotype was not ideal, or some factor related to the GFP-P2A-ND1 sequence, or because of the intravitreal injection. To find the answer, based on our studies of the mouse brain (Chen et al., 2020; Xiang et al., 2021; Zheng et al., 2022), we engineered a new vector AAV9 GFAP104::ND1-P2A-GFP that changed into a different serotype (AAV9), added the EF1α enhancer to increase ND1 expression, and switched the sequence to ND1-P2A-GFP (Figure 3A). We also changed the injection site from intravitreal to subretinal (Figure 3B). Interestingly, after these changes, we found that subretinal injection of AAV9 ND1-GFP resulted in efficient expression of ND1 (red) in infected Müller cells (green), which was confirmed by immunostaining with Müller glia marker GS (purple) (Figure 3D bottom row). In contrast, only weak expression of ND1 was observed in AAV7m8 GFP-ND1 infected retinas (Figure 3C, bottom row) and no ND1 expression was observed in either control group (top rows in Figure 3C, and D). Therefore, we employed this new AAV9 vector that produced high ND1 expression levels for further experimental analyses.
Figure 4|Enhanced ND1 converts Müller cells into outer retinal neurons overtime.
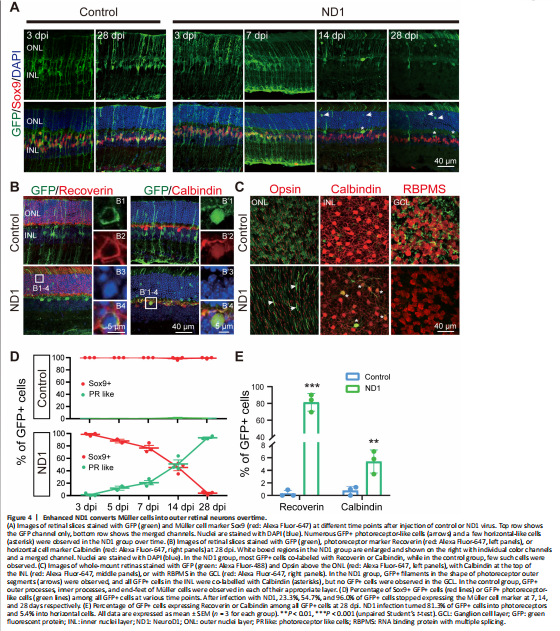
After confirming ND1 expression in Müller cells, we continued to investigate whether this new AAV9 ND1 vector can convert Müller cells into neurons. To understand how ND1 might cause changes in Müller cells, we looked at more time points (3, 5, 7, 14 and 28 dpi). In the control group, GFP+ cells stayed as Müller cells with Sox9 expression until the last measurement at 28 dpi (Figure 4A, left two columns). In the ND1 group, the AAV9 ND1-GFP-infected cells displayed typical Müller cell morphology from 3 dpi until 7 dpi, and the majority of GFP+ cells expressed Sox9 (Figure 4A, ND1 group, 3 and 7 dpi, 5 dpi not shown). However, by 14 dpi, Müller cell morphology disappeared among the ND1-GFP-infected cells; instead, the majority of GFP+ cells appeared in the ONL, where photoreceptor cell somas were typically identified (Figure 4A, ND1 group, 14 dpi). We also observed a number of GFP+ filaments protruding outside the ONL, reminiscent of the filament from photoreceptor cells (Figure 4A, ND1 group, 14 dpi). By 28 dpi, many GFP+ cells could be found in the ONL, and the number of filament-like protrusions outside the ONL had increased (Figure 4A, ND1 group, 28 dpi). Immunostaining for Recoverin indicated that the majority of the converted cells were photoreceptors (Figure 4B, left column, squared region enlarged in B1–4, quantification shown in Figure 4E). Additionally, we also found a small number of converted cells expressing Calbindin, a marker for horizontal cells (Figure 4B, right column, squared region enlarged in B’1–4). ND1-induced cell conversion was also clear from the whole-mount retina images (Figure 4C). In the control group, GFP+ cells showed no overlap with Opsin, Calbindin, or RBPMS (Figure 4C, top row) in the ONL, INL, or GCL respectively. In contrast, in the ND1 group, there were many GFP+ filaments in ONL, and a few GFP+ cell somas co-localized with Calbindin in INL, but few co-localized with RBPMS in GCL (Figure 4C, bottom row). Quantitative analyses at different time points revealed that in the control group, essentially all the viral infected cells were Sox9+ Müller cells, and were rarely located in the ONL (Figure 4D, top panel, red line). In the ND1 group, the ND1-GFP-infected cells showed a gradual loss of Sox9, accompanied by a gradual increase in photoreceptors (green line) in the ONL (Figure 4D, bottom panel). Quantified immunostaining results (28 dpi) also showed that 81.3% of ND1-GFP-infected cells expressed Recoverin, and 5.4% of ND1-GFP-infected cells expressed Calbindin (Figure 4E). These results indicate an ND1-induced time-dependent gradual conversion of Müller cells into outer retinal neurons in the adult mouse retina.
Figure 5|Dose-dependent conversion of Müller cells by ND1.
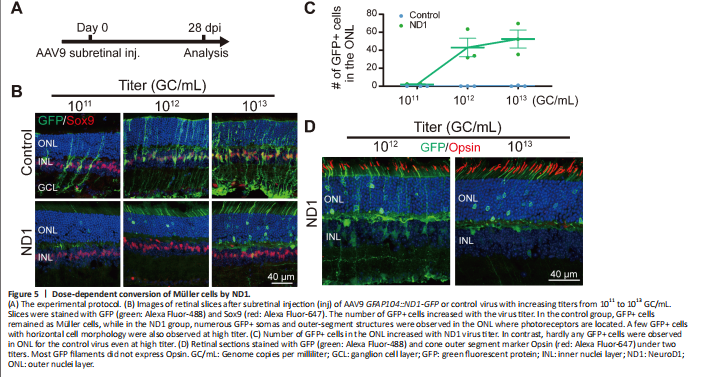
Next, we investigated different AAV doses to find the best one for converting Müller cells to neurons. Subretinal injection of the control AAV9 GFAP104::GFP and the experimental AAV9 GFAP104::ND1-P2A-GFP at 1011, 1012, or 1013 genome copies per milliliter (GC/mL) (with the same volume of 0.8 μL) was performed, and retinas were collected at 28 dpi for immunostaining (Figure 5A and B). In the control group (Figure 5B, top row), we observed a small number of GFP-infected Müller cells expressing Sox9 at the lowest dose of 1011 GC/mL, but the number of GFP+ cells were significantly higher for the medium dose of 1012 GC/mL, and even higher at the largest dose of 1013 GC/mL.
No obvious GFP+ cells were identified in the ONL of the control group at any of the three doses (Figure 5B, top row). In the ND1 group (Figure 5B, bottom row), we rarely detected GFP+ Müller cells at the lowest dose, except for a few GFP+ cells in the ONL. However, at the medium dose we observed more ND1-GFP-converted cells in the ONL, with many GFP+ filaments in the outer segment of the ONL (Figure 5B, bottom row). At the high dose, we detected even more ND1-GFP-converted cells in the ONL. The dose-dependent conversion curve is shown in Figure 5C. Immunostaining with Opsin at the medium and high doses revealed that except for a few instances, the majority of GFP+ filaments in the ND1 group did not express Opsin (Figure 5D), suggesting that these cells were likely rod photoreceptor cells rather than cone cells. On the basis of these dose-dependent results, we recommend 1012 GC/mL for future retinal conversion studies, because the conversion efficiency was close to what the higher dose achieved. Together, our results suggest that expression of ND1 can convert Müller cells into rod photoreceptors in a dose-dependent manner.
Figure 6|Neither virus with GFAP promoter infects retinal astrocytes.
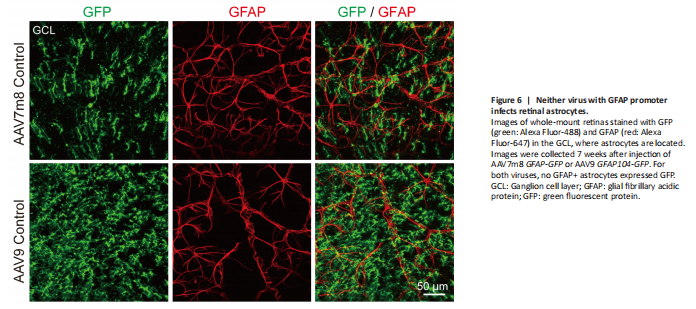
Unlike in the brain and spinal cord where AAV9 vectors infect astrocytes efficiently, we were surprised that they do not infect astrocytes in the retina (Figure 6). Instead, our AAV9 vectors mainly targeted Müller cells with high specificity and infection efficiency. Because retinal astrocytes are also GFAP-positive, one possibility may be that retinal astrocytes lack the appropriate AAV receptors to endocytose AAV particles. Another possibility is that the lineage of Müller cells and retinal neurons is very close, both derived from retinal progenitor cells, while retinal astrocytes come from optic nerves (Hamon et al., 2016; Reemst et al., 2016). Therefore, Müller cells may be more likely to trans-differentiate into their neighboring neurons than retinal astrocytes that come from a different lineage. The precise mechanism needs further investigation.