视神经损伤
-
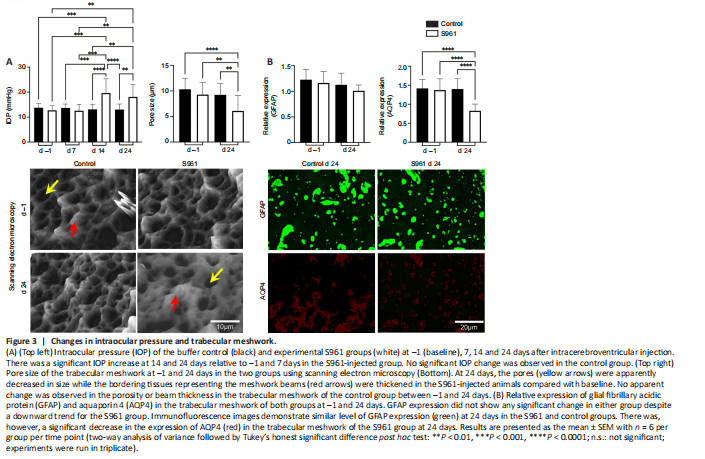
Figure 3|Changes in intraocular pressure and trabecular meshwork.

As shown in Figure 3A, two-way analysis of variance (ANOVA) of intraocular pressure revealed a statistically significant interaction between the effects of group and time (F(1,19) = 13.28, P = 0.0017). Tukey’s honestly significant difference (HSD) post hoc test indicated no significant change in intraocular pressure between groups at baseline or between baseline and 7 days after first intracerebroventricular injection in either group (all P > 0.05). However, the experimental S961 group but not the buffer control group showed a significant increase in intraocular pressure at 14 (P < 0.001) and 24 days (P < 0.001) after the first intracerebroventricular injection, indicating that intraocular pressure elevation did not occur in the experimental group until 2 weeks post-injection and persisted through the end of the experimental period. No significant baseline intraocular pressure difference was observed between animals sacrificed at baseline and animals sacrificed at 24 days (all P > 0.05). The trabecular meshwork showed narrowing of the pores and thickening of the beams in the experimental group at 24 days relative to the control group. These changes were accompanied by downregulation of AQP4 with no significant change in GFAP expression as shown in Figure 3B.
Figure 4|Immunohistochemical and cellular alterations in the retina.

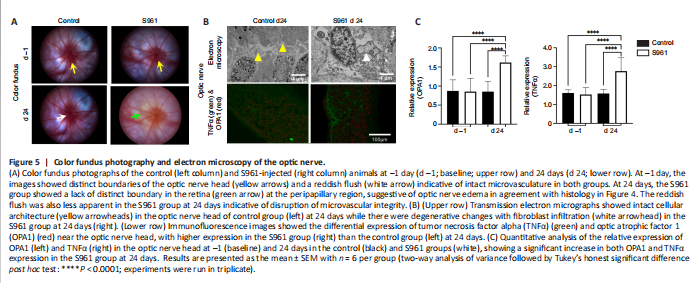
Figure 5|Color fundus photography and electron microscopy of the optic nerve.

Histological examination of the retinal cross sections revealed loss of cells in the ganglion cell layer and dystrophic changes in the photoreceptor layer at 24 days after first intracerebroventricular S961 injection (Figure 4). The cell density of the retinal ganglion cell layer decreased significantly in the S961 group at 24 days with a mean difference of 1412 cells/mm2 compared with baseline (P < 0.001), and a mean difference of 1020 cells/mm2 between experimental and control groups at 24 days (P < 0.001). An apparent increase in the size of nuclei was also observed in the S961 group, indicating apoptosis. No significant difference was observed in the average retinal ganglion cell density between experimental and control eyes at baseline (P = 0.712). These retinal changes were accompanied by peripapillary atrophy identified as loss of reddish flush and ensuing pallor around the optic nerve head by color fundus photography (Figure 5).
The effects of S961 on the expression of InR, GFAP, AQP4, TNFα, and OPA1 were also investigated in the eye and optic nerve (Figures 5–7). In the retina, there was a significant increase in GFAP expression across the retinal layers at 24 days after S961 injection when compared to baseline (P < 0.001), while no significant change was observed in the control group between baseline and 24 days (Figure 4). The experimental S961 group also showed a significant decrease in InR expression in the retinal ganglion cell layer at 24 days (P < 0.001) but an opposite trend of increased InR expression in the photoreceptor layer (P < 0.001; Figure 4). In the optic nerve, there was a significant increase in TNFα and OPA1 expression at 24 days after S961 injection compared with baseline (P < 0.001), while no significant change was observed in the control group between baseline and 24 days (Figure 5B and C).
Figure 6| Immunohistochemical changes in the ciliary bodies.

Figure 7|Immunohistochemical changes in the optic nerve.

In the ciliary bodies, a significant increase in AQP4 expression was observed in the experimental S961 group (P < 0.001), but not the control group (P > 0.05) at 24 days after intracerebroventricular injection (Figure 6). In contrast, in the optic nerve, a significant decrease in AQP4 expression was observed in the experimental S961 group at 24 days (P < 0.001; Figure 7). No significant difference in AQP4 expression was observed in the ciliary bodies or optic nerve of the control group between baseline and 24 days (all P > 0.05). In the optic nerve, a significant decrease in InR expression was observed at 24 days in the experimental S961 group (P < 0.001), but not the control group (P > 0.05) after intracerebroventricular injection. Relative to baseline, increased GFAP and TNFα expression in the optic nerve at 24 days (P < 0.001) were also observed in the S961 group but not the control group (P > 0.05).