脑损伤
-
Figure 1|Erastin induces cell death (A) and ROS production (B) in hippocampal HT22 neurons.
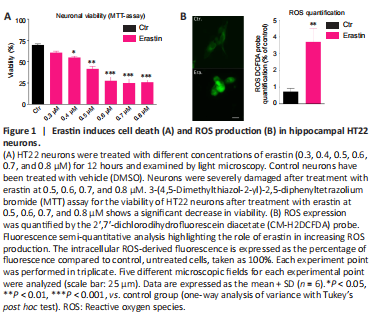
Dose-response tests evaluated the effect of treatment of HT-22 neurons with different concentrations of erastin and showed decreased survival of neurons over time (MTT assay). Erastin decreased significantly the viability of hippocampal HT22 neurons. The cell survival rate was almost the lowest in HT-22 cells treated with 0.6 μM erastin for 12 hours. For our study, we selected the 0.5 μM erastin (Figure 1A).
Another characteristic of ferroptosis is lipid peroxidation (Gao and Dixon, 2016). To investigate whether erastin caused lipid peroxidation in the hippocampal HT22 neurons, we determined the levels of ROS. The ROS levels were significantly higher in the erastin group than in the control group (P < 0.01). The analysis of ?uorescent images clearly showed that erastin increased the amounts of ROS, con?rming the oxidative role of erastin leading to neuronal toxicity (Figure 1B).
Figure 2|Erastin induced changes in the levels of the autophagy related protein LC3-II.

The distribution of endogenous LC3-II in cells prior to and following erastin treatment was monitored by indirect immunofluorescence staining to examine whether autophagy was induced by erastin treatment. As demonstrated in Figure 2A and B, a greater number of dots were apparent in erastin-treated neurons compared with the control cells (6 and 16 hours: P < 0.01; 24 hours: P < 0.05).
Figure 5|The x-CT- (A), GPX4 (B), FTH (C), mtFt (D), NCOA4 (E) and ACSL4 (F) immunoreactivities (IR) in HT 22 neurons collected from controls and at 6, 16, and 24 hours after incubation with erastin.

As biomarkers of ferroptosis, the expression of x-CT (a sodium-independent cystine-glutamate antiporter) and GPX4 were analyzed. We determined the expression of GPX4 after treating the HT22 cells with the GPX4 inhibitor and ferroptosis inducer, erastin. The densitometric analysis of GPX4-immunoreactivity and GPX4-immunoblots revealed a statistically significant decrease upon erastin treatment as early as 6 hours post-incubation (6 hours: P < 0.05; 16 and 24 hours: P < 0.01; Figures 4 and 5B). The x-CT-immunoreactivity as well as the density of immunoblots was more intense in controls than in erastin-treated cells. The x-CT levels were significantly decreased at all the time points examined in erastin-treated cells (P < 0.01; Figures 4 and 5A).
Erastin does not alter significantly the FTH and mtFt levels in HT22 cells
We determined the expression levels of FTH and mtFt after treating the HT22 cells with the GPX4 inhibitor and ferroptosis inducer, erastin. FTH and mtFt levels were measured in control and erastin-treated cultures at 6, 16, and 24 hours post-incubation. Western blot and immunofluorescence analysis revealed no remarkable alterations in FTH/mtFt expression upon erastin treatment (P > 0.05; Figures 4 and 5C and D), except for a slight transient increase in FTH levels at 6 hours after incubation with erastin.
Erastin-induced alterations in NCOA4- and ACSL-4-levels in HT22 cells
NCOA4 was identified as a key player in ferritinophagy, serving as an autophagic cargo receptor to facilitate the delivery of ferritin for lysosomal degradation (Mancias et al., 2014). Immunofluorescence and western blot analysis showed a gradual decrease in NCOA4 levels at 6, 16, and 24 hours post-incubation with erastin (Figures 4 and 5E).
ACSL4 is one of the main enzymes which promote ferroptosis (Yuan et al., 2016). Cell lines with deleted ACSL4 gene showed less susceptibility to ferroptosis inducers such as erastin and 1S,3R-Methyl 2-(2-chloroacetyl)-2,3,4,9-tetrahydro-1-[4-(methoxycarbonyl)phenyl]-1H-pyrido[3,4-b]indole-3-carboxylat (RSL-3) (Dixon et al., 2015; Doll et al., 2017). In addition, in some cell lines, the abundance of ACSL4 could be regarded as a biomarker of ferroptosis sensitivity (Yuan et al., 2016). Immunofluorescence and western blot analysis showed a gradual decrease in ACSL4 levels at 6, 16, and 24 hours post-incubation (Figures 4 and 5F).