神经退行性病
-
Figure 2|The expression of 5-HT in both SOD1*G93A TG and WT mice.
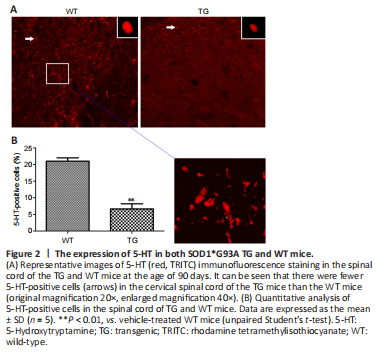
5-HT immunopositivity was observed in the cervical spinal cord of both WT and TG mice using immunofluorescence staining (Figure 2A). The percentage of 5-HT-positive cells in this region was significantly lower in the TG mice than in the WT mice (P = 0.0011; Figure 2B).
Figure 7|Effects of granisetron, piboserod, and ritanserin on the number of TDP-43-positive cells in the cervical segment of spinal cord in SOD1*G93A TG and WT mice.
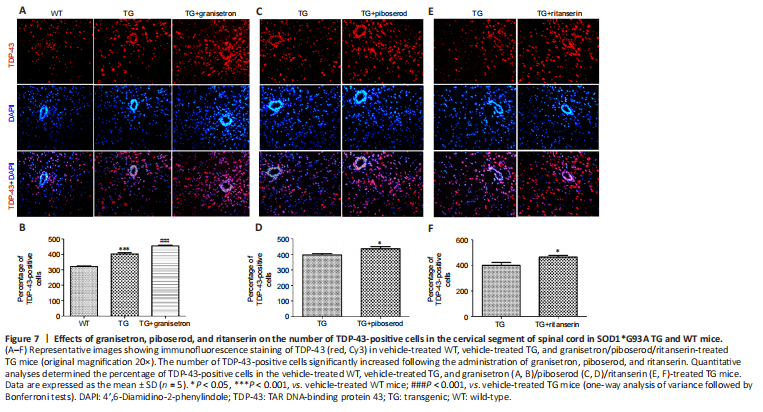
Immunofluorescence staining was used to determine the number of TDP-43-positive cells in the spinal cord. In line with the Western blot results, it was found that the number of TDP-43-positive cells was higher in the TG mice than in the WT mice (P = 0.0002; Figure 7A and B). In addition, the TG mice in the 5-HT receptor antagonist groups had significantly higher numbers of TDP-43-positive cells compared with the vehicle-treated TG mice: granisetron (P = 0.0009; Figure 7A, and B), piboserod (P = 0.0142; Figure 7C and D), and ritanserin (P = 0.0139; Figure 7E and F). These results therefore support the finding that granisetron, piboserod, and ritanserin promote the expression of TDP-43.
Figure 8|Effects of granisetron, piboserod, and ritanserin on the subcellular localization of TDP-43 in SOD1*G93A TG and WT mice.

The immunofluorescence staining images were analyzed to determine the subcellular localization of TDP-43. It was found that the percentage of cells with TDP-43 in the cytoplasm was significantly higher in the TG mice compared with the WT mice (P = 0.0001; Figure 8A); this percentage was also significantly higher in the TG mice administered granisetron (P = 0.0003; Figure 8B), piboserod (P = 0.0087; Figure 8C), or ritanserin (P = 0.0130; Figure 8D) compared with the vehicle-treated TG mice. In contrast, the percentage of cells with TDP-43 in the nucleus was significantly lower in the TG mice administered granisetron (P = 0.0003; Figure 8E), piboserod (P = 0.0087; Figure 8F), or ritanserin (P = 0.0130; Figure 8G) compared with the vehicle-treated TG mice. Together, these findings indicate that granisetron, piboserod, and ritanserin accelerate the abnormal distribution of TDP-43.
Figure 9|Effects of granisetron on the astrocytes, microglia, and neurons of SOD1*G93A TG and WT mice.
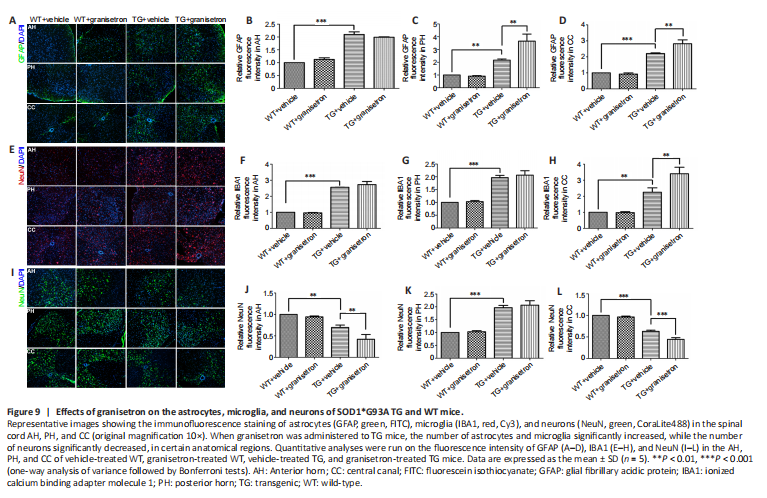
We examined the effects of granisetron on the spinal cord astrocytes (marked by GFAP), microglia (marked by IBA1), and neurons (marked by NeuN). We observed that the TG mice had more astrocytes in the anterior horn (AH), posterior horn (PH), and central canal (CC) compared with the WT mice (Figure 9A). The administration of granisetron was not found to affect the proliferation of astrocytes (GFAP fluorescent intensity) in the AH of the TG mice (P > 0.05; Figure 9B); however, there were more astrocytes in both the PH (P = 0.0010; Figure 9C) and the CC (P = 0.0012; Figure 9D) of the granisetron-treated TG mice. We found that the TG mice also had higher numbers of microglia in the AH, PH, and CC compared with the WT mice (Figure 9E). Granisetron was not found to affect the proliferation of microglia (IBA1 fluorescent intensity) in the AH or the PH (both P > 0.05; Figure 9F and G) of the TG mice (compared with the vehicle-treated TG mice), but there was a significant increase in the number of microglia in the CC (P = 0.0016; Figure 9H). We found that there were fewer neurons in the AH, PH, and CC of the TG mice compared with the WT mice (Figure 9I). Granisetron was found to lower the number of neurons in both the AH (P = 0.0018; Figure 9J) and the CC (P = 0.0003; Figure 9L) of the TG mice compared with the vehicle-treated TG mice. However, there was no significant effect on the number of neurons in the PH (P > 0.05; Figure 9K). These results show that the administration of granisetron to TG mice led to an increase in the numbers of astrocytes and microglia, and a decrease in the number of neurons, in specific anatomical regions.
Figure 10|Effects of piboserod on the astrocytes, microglia, and neurons of SOD1*G93A TG and WT mice.

We examined the effects of piboserod on the astrocytes, microglia, and neurons in the spinal cord. We found that the number of astrocytes was higher in the AH, PH, and CC of the TG mice compared with the WT mice (Figure 10A). Piboserod did not significantly affect the astrocyte proliferation in the AH of the TG mice (P > 0.05; Figure 10B), but there was a significantly higher number of astrocytes in both the PH (P = 0.0004; Figure 10C) and the CC (P = 0.0005; Figure 10D). Higher number of microglia were also found in the AH, PH, and CC of the TG mice compared with the WT mice (Figure 10E). The TG mice administered piboserod were found to have more microglia in both the AH and the CC compared with the vehicle-treated TG mice (AH: P = 0.0011; CC: P = 0.0002; Figure 10F and H), but there was no significant difference in the PH (P > 0.05; Figure 10G). We found that there were fewer neurons in the AH, PH, and CC of the TG mice compared with the WT mice (Figure 10I). The administration of piboserod to the TG mice lowered the number of neurons in the AH (P = 0.0014; Figure 10J), PH (P = 0.0307; Figure 10K), and CC (P = 0.0007; Figure 10L), compared with the vehicle-treated TG mice. These results show that TG mice treated with piboserod had more astrocytes and microglia, and fewer neurons, in specific anatomical regions.
Figure 11|Effects of ritanserin on the astrocytes, microglia, and neurons of SOD1*G93A TG and WT mice.

We examined the effects of ritanserin on the astrocytes, microglia, and neurons in the spinal cord. Our data showed that the TG mice had more astrocytes in the AH, PH, and CC compared with the WT mice (Figure 11A). Ritanserin did not significantly affect the number of astrocytes in the AH of the TG mice (P > 0.05; Figure 11B), but more astrocytes were found in the PH (P = 0.0001; Figure 11C) and the CC (P = 0.0001; Figure 11D) following the intervention. The TG mice also had more microglia in the AH, PH, and CC compared with the WT mice (Figure 11E). Ritanserin led to a significant increase in the number of microglia in the AH of the TG mice compared with the vehicle-treated TG mice (P = 0.0002; Figure 11F), but there was no significant difference in the PH or the CC (P > 0.05; Figure 11G and H). We found that the TG mice had fewer neurons in the AH, PH, and CC compared with the WT mice (Figure 11I). Ritanserin led to significantly lower number of neurons in the AH (P = 0.0152; Figure 11J), PH (P = 0.0075; Figure 11K), and CC (P = 0.0216; Figure 11L) of the TG mice compared with the vehicle-treated TG mice. These results show that the administration of ritanserin to TG mice increased the number of astrocytes and microglia, and decreased the number of neurons, in specific anatomical regions.