脊髓损伤
-
Figure 2|Histology of spinal cord from the sham and chronic CSCI groups.
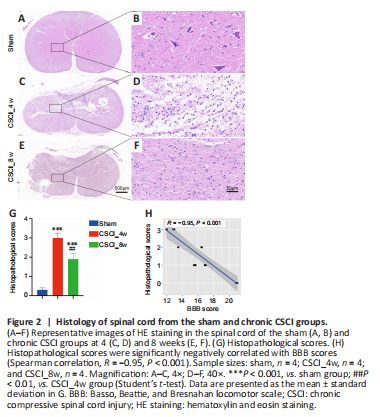
The microstructure of the spinal cords stained with H&E was observed in each group at different magnifications. The spinal cords in the sham group were intact at different magnifications (Figure 2A and B). At low magnification, the extracellular matrix was degraded in the chronic CSCI group, leaving a large cavity in the spinal cord at 4 weeks after chronic compression. At high magnification, abnormal structure of the posterior funiculus and dorsal horn, prevalent edema, and neuronal nuclei fragmentation were observed. Some neurons changed to an elongated spindle shape owing to cytoplasmic loss; most of these were observed in the posterior horn (Figure 2C and D). At 8 weeks following chronic compression, although the spinal cord dorsal horn remained disordered, the spinal cord edema and inflammatory infiltration were significantly improved compared with those at week 4. The extracellular matrix was remodeled, and there appeared to be an increase of neurons and vessels (Figure 2E and F). As shown in Figure 2G, the histopathological scores of the chronic CSCI rats were at their highest at week 4 (P < 0.001) and had significantly decreased at week 8 (P < 0.01), indicating that the pathological damage was most severe in the middle of our observation period, and started resolving by the end of observation. Moreover, the histopathological scores of the rats were significantly negatively correlated with BBB scores (R = –0.95, P < 0.001; Figure 2H), demonstrating the histopathological and neurobehavioral consistency of this chronic CSCI model.
Figure 5| Ferroptosis-specific mitochondrial changes and MDA accumulation levels after chronic CSCI.
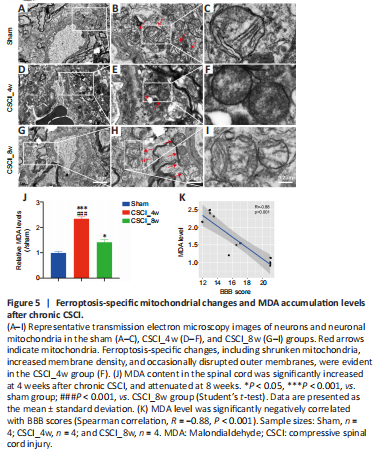
Given that the DEGs were related to ferroptosis, we used TEM to observe any ultrastructural changes in the neurons and to confirm the occurrence of ferroptosis. Compared with those in the sham group, the endoplasmic reticulum membranes and intracellular structures in the CSCI_4w and CSCI_8w groups were severely disrupted (Figure 5A, D and G). Compared with the normal mitochondria in the sham group, the mitochondria in the CSCI_4w group had noticeable morphological abnormalities, including smaller size, lack of cristae, swelling, and vacuoles (Figure 5B, E and H). These morphological changes are associated with ferroptosis (Chen et al., 2021a). In the CSCI_8w group, the mitochondrial abnormalities appeared to be improved, and mitochondrial swelling and vacuoles were ameliorated (Figure 5C, F and I). The MDA content in the spinal cord was significantly increased in the CSCI_4w group compared with the sham (P < 0.001) or CSCI_8w group (P < 0.001; Figure 5J). MDA level was significantly negatively correlated with BBB scores (rs = –0.88, P < 0.001; Figure 5K).These results indicated that oxidative damage in mitochondria and the ferroptosis activity peaked at 4 weeks and was attenuated at 8 weeks after chronic CSCI.
Figure 6|IF of MafG and GPX4 in neurons after chronic CSCI.
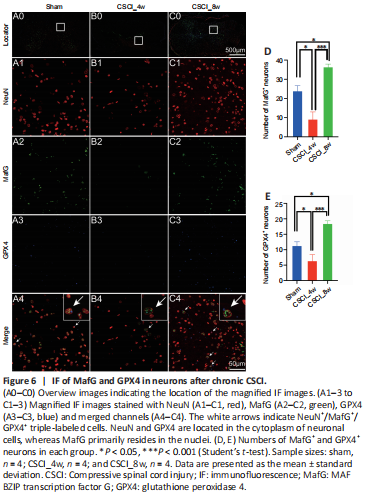
GPX4 and MafG are master negative regulator genes of ferroptosis (Friedmann Angeli et al., 2014; Yang et al., 2014; Sun et al., 2016). We used immunofluorescence analysis to investigate the localization and expression of GPX4 and MafG in spinal cord cells. NeuN is a classical neuronal marker (Gusel’nikova and Korzhevskiy, 2015). Some GPX4+ and MafG+ neuronal cells were observed in the spinal cord sections of the sham group (Figure 6A). The number of MafG+/NeuN+ cells decreased sharply at 4 weeks (P = 0.021) and increased at 8 weeks (P = 0.034) after chronic CSCI, compared with that of the sham group. The number of GPX4+/NeuN+ cells showed a similar trend (Sham vs. CSCI_4w: P = 0.042; CSCI_4w vs. CSCI_8w: P < 0.001; Figure 6B–E).