周围神经损伤
-
Figure 1|Quantitative methods on the MAP2 immunostaining and Golgi-Cox staining images and confirmation of RhoA conditional knockout in spinal motoneurons.
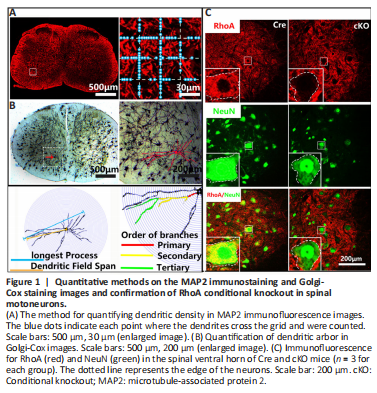
Under a fluorescent microscope (Leica, Wetzlar, Germany), a 200 μm × 200 μm digital image was captured in the spinal anterolateral horn of each MAP2 immunostained section, as shown in Figure 1A. Using Photoshop 8.0 software (Adobe, San Jose, CA, USA), three vertical lines and three horizontal lines at intervals of 50 μm were superimposed onto the images. The number of MAP2-positive dendrites that intercepted with the superimposed lines was counted and indicated the density of dendrites. To determine dendritic integrity, the number of dendrites with more than two intersections was counted.
After Golgi-Cox staining, the neurons were traced and analyzed by the Sholl technique as described previously (Han et al., 2019). Images (730 μm × 730 μm) of each section were captured from the anterolateral horn of spinal cord under a light microscope (Leica). Five sections from each sample (the C6–C7 spinal cord) and five mice from each group were used for evaluation. Two neurons with structural integrity in each section were selected; the cell body and dendrites were traced and the redundant background in the images was removed using Photoshop software. The images were subjected to Sholl analysis using ImageJ software (v8.1, National Institutes of Health, Bethesda, MD, USA) (Schneider et al., 2012). The length of the longest dendrite, total length of all dendrites, dendritic span (the longest diameter of the range covered by all dendrites), and the number of dendritic primary, secondary, and tertiary branches were quantified to indicate the dendrite arborization complexity and structural integrity of each neuron (Figure 1B; Srinivasan et al., 2020).
All statistical analyses were performed with GraphPad Prism software (v8.0.1, GraphPad Software, San Diego, CA, USA, www.graphpad.com) and SPSS (v26.0.0.0.0, IBM, Armonk, NY, USA) using one-way analysis of variance followed by Bonferroni’s multiple test. A P value of < 0.05 was considered statistically significant.
To investigate the role of RhoA in dendrite degeneration and regeneration of spinal motor neurons after PNI, we specifically knocked out RhoA in motor neurons by generating RhoAflox/flox;HB9Cre+ (cKO) mice, as described in Methods. Our preliminary data indicated RhoA is expressed at low levels in na?ve adult motor neurons but is up-regulated after PNI. As shown in Figure 1C, in the Cre control mice, RhoA was highly expressed in the spinal ventral horn at 7 dpi. In contrast, neurons in the spinal ventral horn of the cKO mice were negative for RhoA, while the surrounding cells were positive for RhoA. These data demonstrated that RhoA had been specifically knocked out in motor neurons in the cKO mice.
Figure 2|RhoA knockout attenuates spinal motor neuronal dendrite loss and fragmentation after brachial plexus transection.
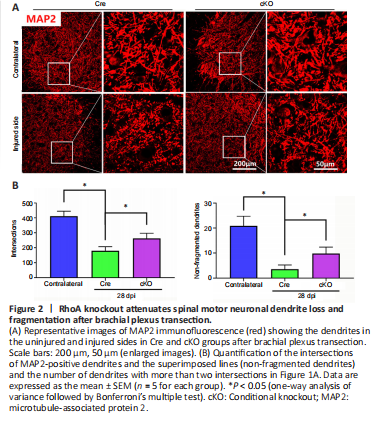
To evaluate the role of RhoA in motor neuron dendrite degeneration after PNI, we first examined the overall profile of dendrite distribution in the spinal cord by MAP2 immunostaining. After brachial plexus transection, the density of MAP2-positive dendrites was markedly decreased in the spinal ventral horn of the injured side compared with the uninjured side in both Cre and cKO groups; many dendrites were broken into short segments (Figure 2A). Quantification of the dendrite density revealed that dendrite density (quantified by dendrite intersections on MAP immunostaining, as shown in Methods) and fragmentation were higher in the cKO mice compared with the Cre mice (Figure 2B).
Figure 3|RhoA knockout alleviates the degeneration of dendrite arborization after brachial plexus transection.
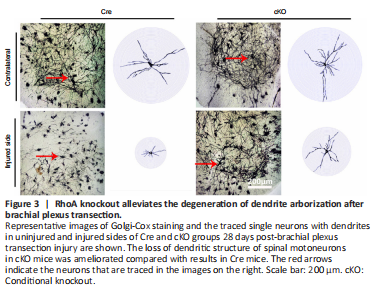
Similar to the MAP2 immunostaining results, the Golgi staining images also showed that dendrites in the injury side of the cKO group were denser than that of the Cre group (Figure 3). The individual neurons with intact soma were tracked out with their continuous dendrites and then subjected to Sholl analysis. The results showed that the intersections of dendrites with concentric circles at each radius were dramatically decreased on the injured side compared with the uninjured side in both the cKO group and Cre group (Figure 3).
Figure 5|RhoA knockout enhances restoration of dendrite density and integrity after brachial plexus crush injury.
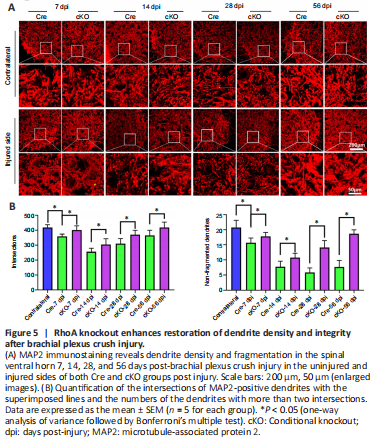
To investigate the role of RhoA in dendrite reconstruction after PNI, we used the brachial plexus crush model. MAP2 staining results showed that the dendrite density and integrity of the Cre mice decreased from 7 dpi to 14 dpi; the density increased from 28 dpi to 56 dpi while the integrity was maintained at a low level (Figure 5A). Quantification showed that the decreases in dendrite density and integrity at 7 and 14 dpi were attenuated in the cKO mice compared with those of Cre group; dendrite density and integrity were also increased at 28 and 56 dpi in the cKO group (Figure 5B).
Figure 6|RhoA knockout accelerates the recovery of dendrite arborization in the model of brachial plexus crush injury.
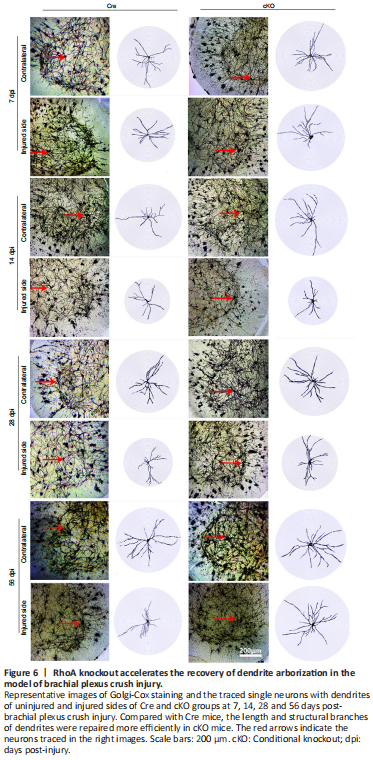
To further investigate the role of RhoA in dendrite regeneration, Golgi-Cox staining and Sholl analysis were performed on the spinal cord sections of brachial plexus crush model. As expected, dendrite arborization of the uninjured side was similar at all time points in both cKO and Cre groups. On the injured side, dendrite arborization retracted from 7 dpi to 14 dpi and then showed recovery from 28 dpi to 56 dpi, and the recovery of dendrite arborization in the cKO group improved to a higher degree than the Cre group (Figure 6). These results were consistent with the pattern of dendrite density and integrity shown by MAP2 staining.