神经损伤与修复
-
Figure 1 | NTF-mediated astrocyte conversion in adult mouse cortex.

Since a high leakage rate caused by injection of high titer AAV was reported (Wang et al., 2021a), the authenticity of gliato-neuron conversion has been questioned. To address this, we injected AAVs expressing three different NTFs, including NeuroD1, Ascl1, and Dlx2, into mouse cortices subjected to stab injury to examine their impact on cortical astrocytes (Figure 1A). The same AAV9 vector containing the GFAP104
promoter was used to express GFP alone, or GFP plus different NTFs (Figure 1A, GFAP104::GFP, GFAP104::Ascl1- GFP, GFAP104::NeuroD1-GFP, GFAP104::Dlx2-GFP) in reactive astrocytes, and examined astrocytic changes for up to 2 months following viral infection. If AtN conversion did not occur, then all AAV-infected astrocytes would maintain their astrocytic identity throughout the experimental time. Cells infected with the control virus GFAP104::GFP did indeed retain their astrocytic properties from 3 to 60 dpi, as demonstrated by immunopositivity for the astrocytic markers Sox9, GFAP, and S100β (Figure 1B–D), and rarely for the neuronal marker NeuN (Figure 1E, quantified in Figure 1G). The decrease in the GFAP signal at 60 dpi in the control group was likely due to the fact that resting astrocytes in the mouse cortex do not express high levels of GFAP (Figure 1F), while injured reactive astrocytes express a high level of GFAP (Anderson et al., 2014; Huang et al., 2023). Only about 6% of GFAP104::GFP-infected cells were NeuN+ neurons at 60 dpi, indicating that our AAV viral system resulted in specific expression of the transgenes in astrocytes and that the transgenes were only expressed in a very low proportion of pre-existing neurons. Consistent with these observations, at 3 dpi, the NTF-infected cells were Sox9+ astrocytes (Figure 1H–J). For example, the GFAP104::Ascl1- GFP–infected cells were mainly Sox9+ astrocytes at 3 dpi (Figure 1H, left column); but by 60 dpi, the majority of GFAP104::Ascl1-GFP–infected cells no longer colocalized with Sox9, suggesting that their cell identity had changed (Figure 1H, right column). Similar changes in cell identity occurred from 3 dpi to 60 dpi in cells infected with viruses expressing NeuroD1 (Figure 1I) or Dlx2 (Figure 1J). Quantitative analysis showed a continuous decrease in the expression of astrocytic marker Sox9 after expressing Ascl1 (Figure 1K), NeuroD1 (Figure 1L), or Dlx2 (Figure 1M), in sharp contrast to those control astrocytes expressing GFP (Figure 1G, Sox9). These results clearly indicate that NTF overexpression significantly changes the cell identity of astrocytes infected with the AAV constructs expressing NTFs. Next, we investigated the cell fate adopted by the NTF-overexpressing astrocytes.
Figure 2 | Ascl1, NeuroD1, and Dlx2 gradually reprogram cortical astrocytes into neurons in mice.

To characterize the cell identity of the NTF-overexpressing cells, we performed triple immunostaining to examine NTF expression among neurons and astrocytes. As shown in Figure 2A, Ascl1 (red) was initially only detected in GFAP+ astrocytes (cyan) but not NeuN+ neurons (green) at 3 dpi; however, by 42 dpi, Ascl1 was mainly detected in NeuN+ neurons but rarely in GFAP+ astrocytes, suggesting that the Ascl1- expressing astrocytes had gradually converted into neurons. We observed a similar pattern of cell type conversion among NeuroD1-infected astrocytes and Dlx2-infected astrocytes, where both NeuroD1 and Dlx2 were initially detected in astrocytic nuclei at 3 dpi but later were only detected in neuronal nuclei (Figure 2B and C). Quantitative analysis showed that, among NTF-overexpressing cells, the percentage of GFAP+ astrocytes gradually decreased from ~90% at 3 dpi to < 10% at 42 dpi (Figure 2D), while the percentage of NeuN+ neurons gradually increased from < 10% at 3 dpi to 60%–90% at 42 dpi (Figure 2E). To exclude the unlikely possibility of the NTFs being spontaneously expressed in neuronal nuclei through an unknown mechanism, we further evaluated cytosolic GFP expression in virus-infected cells. Similar to what was observed for NTFs, we found that at 3 dpi, very few NeuN+ cells expressed GFP, but at later timepoints GFP was mainly expressed by NeuN+ neurons (Figure 2F–K). While the proportion of NeuN+ neurons increased among all NTF-overexpressing cells over time, the pace of this increase differed among the three NTFs, with Ascl1 inducing the fastest change, and Dlx2 the slowest (Figure 2E and I–K). These results suggest that, after being infected with AAVs expressing NTFs, astrocytes gradually lose their astrocytic identity and simultaneously acquire a neuronal identity.
Figure 3 | NeuroD1-mediated astrocyte-to-neuron conversion involves a transitional state.
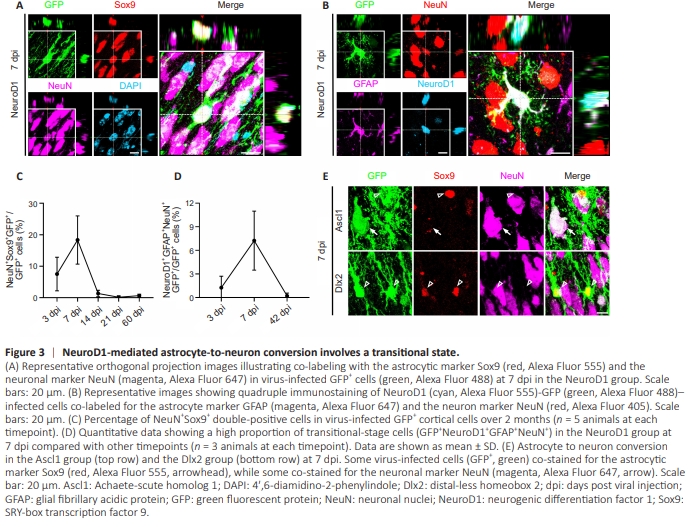
Intriguingly, at 7 dpi after infection, some NeuroD1-GFP– overexpressing cells expressed both Sox9 and NeuN, suggesting a transitional stage between astrocytes and neurons (Figure 3A). Similarly, some NeuroD1-GFP– overexpressing cells expressed both the astrocytic marker GFAP and the neuronal marker NeuN at 7 dpi (Figure 3B). Quantitative analysis showed that this transitional cell population was mainly present during the early stage of conversion, especially at 7 dpi, and was not observed during the late stage of conversion (Figure 3C and D), suggesting that these transitional cells represent a unique intermediate stage during NeuroD1-mediated AtN conversion. Interestingly, such transitional cells were rarely found among Ascl1- overexpressing cells or Dlx2-overexpressing cells (Figure 3E), suggesting that during AtN conversion, different NTFs regulate different genes related to astrocytic and neuronal functions.
Figure 4 | Identification of neuronal subtypes among converted neurons induced by different NTFs in the mouse cortex.

Next we assessed the neuronal subtypes generated by overexpression of different NTFs in the astrocytes of mouse cortices subjected to stab injury. Figure 4A illustrates the overall pattern of cells across different layers in the mouse cortex infected with the control virus AAV9 GFAP104::GFP (green), which were mostly astrocytes. Among cortical neurons, the superficial layer marker Cux1 (red) mainly labeled cortical neurons in layer II–III, while the deep layer marker Ctip2 (cyan) mainly labeled cortical neurons in layer V–VI (Figure 4A). We then examined NTF-converted neurons at 60 dpi in both layer II–III (Figure 4B) and layer V–VI (Figure 4C). Immunostaining showed that converted neurons expressing NTFs also showed Cux1 signals in layer II– III (Figure 4B), and the Ctip2 signals in layer V–VI (Figure 4C). Quantitative analysis revealed differences among the three NTFs. In layer II–III, ~80% of Ascl1-converted neurons were Cux1+ , whereas only 50% of Dlx2-converted neurons were Cux1+ (Figure 4E). On the other hand, in layer V–VI, fewer Ascl1-converted neurons were Ctip2+ than Dlx2-converted neurons (Figure 4F). Moreover, immunostaining at 60 dpi for parvalbumin (PV), a marker of a major subtype of GABAergic neurons in the mouse cortex (Figure 4D), showed that the percentage of PV+ neurons among Ascl1-converted neurons was higher than that among Dlx2-converted neurons (Figure 4G, layer II–VI). Together, these results indicate that, while all three NTFs can convert cortical astrocytes into neurons, the resulting neuronal subtypes differ from each other.
Figure 5 | Dynamic changes in astrocytes during AtN conversion.
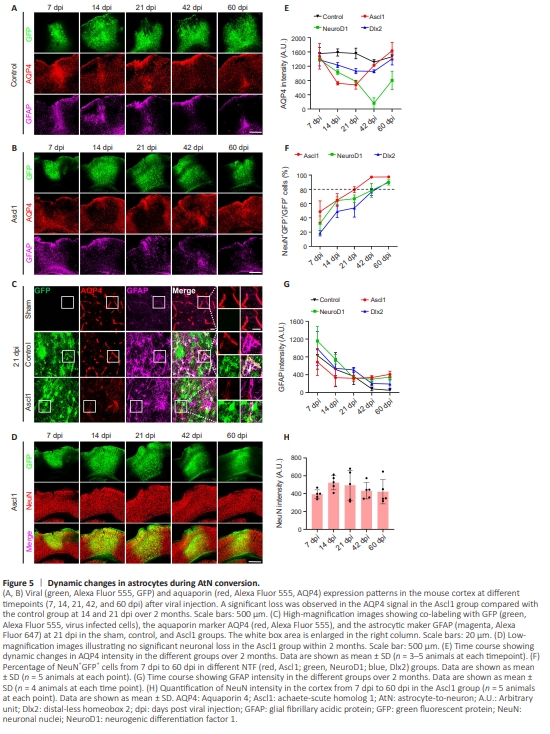
The results described above suggest that cortical astrocytes are gradually converted into neurons after being infected with AAVs expressing the NTFs NeuroD1, Ascl1, and Dlx2. If the AtN conversion does occur, then astrocytic properties should significantly change during the conversion process. Therefore, we examined the expression of a series of astrocytic markers during conversion. Interestingly, we observed a remarkable loss in the AQP4 signal in NTF-infected areas. AQP4 is a water channel that is mainly expressed at the astrocytic endfeet that wrap around blood vessels in a resting state (Nico etal., 2001; Nagelhus and Ottersen, 2013). In the control virus AAV9 GFAP104::GFP group, strong AQP4 signal was detected from 7 dpi to 60 dpi (Figure 5A, red signal). However, cells overexpressing Ascl1-GFP exhibited a significant drop in AQP4 expression at 14 and 21 dpi (Figure 5B, black areas among the red signal). The enlarged images shown in Figure 5C more vividly illustrate the decrease (but not absent) in the AQP4 signal (red) in the Ascl1-GFP–overexpressing areas, where most GFP-labeled cells exhibited neuronal morphology (Figure 5C). Interestingly, while the AQP4 signal decreased in the Ascl1- GFP–overexpressing areas, many GFAP+ astrocytes (magenta) were observed in the same areas (Figure 5C), suggesting that the decrease in the AQP4 signal was not due to depletion of astrocytes. We next asked whether such a dramatic decrease in the AQP4 signal in the Ascl1-overexpressing areas would have a negative impact on the local neurons. Surprisingly, there was no significant difference in NeuN staining between brain areas overexpressing GFP and those overexpressing Ascl1-GFP(Figure 5D and H). A similar decrease in the AQP4 signal was observed in the NeuroD1-GFP–converted (Additional Figure 1A and C) and Dlx2-GFP–converted (Additional Figure 1B, and C) areas. Quantitative analysis of AQP4 intensity showed that, while all three NTFs triggered a decrease in AQP4 signal during AtN conversion, the time course of the decrease in AQP4 signal intensity was quite different among the three factors, dropping most rapidly in cells overexpressing Ascl1 and most slowly in cells overexpressing Dlx2 (Figure 5E). This correlated with the observed conversion rates, as Ascl1- overexpressing cells exhibited the highest conversion rate, and Dlx2 the lowest (Figure 5F). GFAP intensity decreased continuously from 7 dpi to 60 dpi in all groups, including the control group (Figure 5G), reflecting the close association of GFAP expression with injury level. No significant changes in microglia numbers were observed in the NTF-overexpressing areas during the AtN conversion process (Additional Figure 2). The significant decrease in the AQP4 signal during NTFinduced AtN conversion indicates a dramatic change in astrocytic properties during this process.
Figure 6 | Time course of gap junction protein expression in the mouse cortex during astrocyte to neuron conversion.
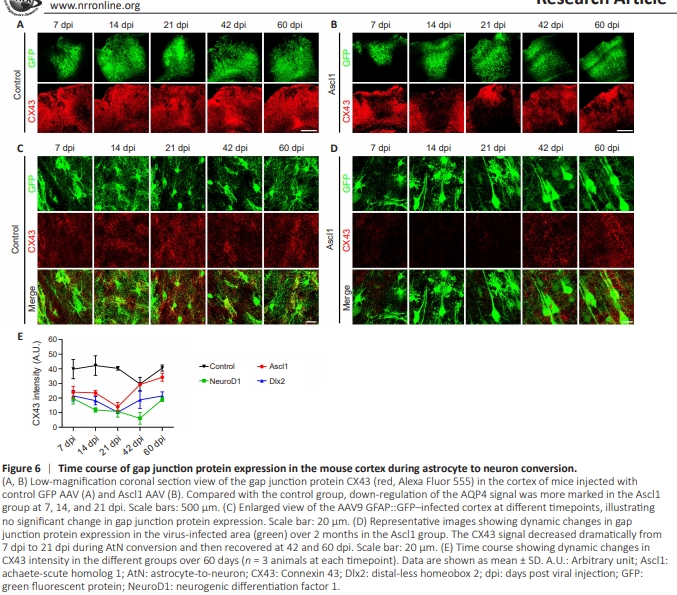
One distinct feature of astrocytes is that they are connected by gap junctions to form a web-like structure (Rash et al., 1997; Bennett et al., 2003). Therefore, we next examined astrocytic gap junctions during NTF-induced AtN conversion. AQP4 distribution within the brain shows striking similarities to the distribution of the gap junction marker connexin-43 (CX43) (Nagy et al., 1997). Similar to the decrease of AQP4 signal, there was a significant drop in the CX43 signal in the Ascl1-overexpressing areas at 14 and 21 dpi (Figure 6B), compared with the GFP control group (Figure 6A). Enlarged images showed that the CX43 signal was diffusely distributed throughout areas infected with the control (GFP) virus from 7 dpi to 60 dpi (Figure 6C, red signal); whereas in the Ascl1-GFP–overexpressing areas, the CX43 signal decreased dramatically from 7 dpi to 21 dpi and then recovered at 42 dpi and 60 dpi (Figure 6D). Similarly, both NeuroD1 and Dlx2 triggered a significant decrease in the CX43 signal in the NTFoverexpressing areas (Additional Figure 3). Quantitative analysis showed a universal decrease in the CX43 signal during NTF-induced AtN conversion (Figure 6E), followed by recovery of the CX43 signal during the late stage of AtN conversion. These results demonstrate that significant changes occurred in the astrocytic gap junctions during AtN conversion.
Figure 7 | Changes in expression of the astrocytic marker S100β during AtN conversion.
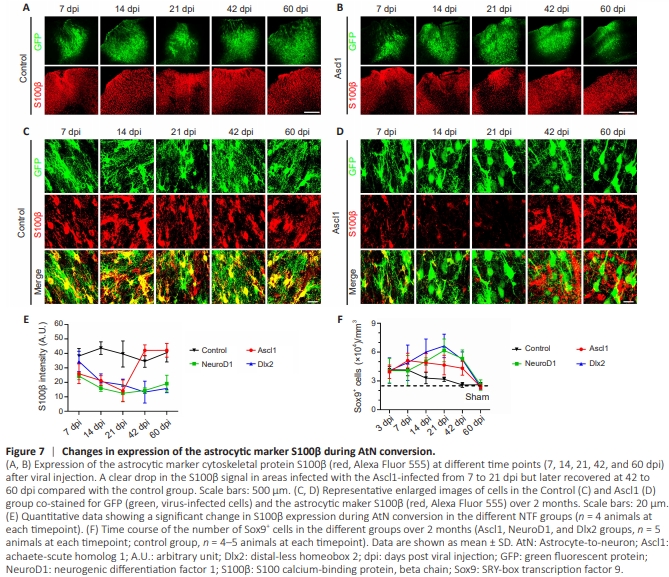
In addition to AQP4 and CX43, we also observed a significant drop in expression of the astrocytic marker S100β during AtNconversion. Compared with the GFP control group (Figure 7A), in which there was no significant change in S100β expression throughout the duration of the experiment, we observed a significant drop in the S100β signal in Ascl1– overexpressing areas from 7 to 21 dpi that recovered at 42 to 60 dpi (Figure 7B). The enlarged images shown in Figure 7C and D more clearly illustrate this decrease in S100β expression in the Ascl1-overexpressing areas, followed by recovery of S100β expression. A similar drop in S100β signal was also observed in NeuroD1– and Dlx2– overexpressing areas (Additional Figure 4). Quantitatively, the areas overexpressing Ascl1 showed the most rapid recovery in S100β signal (Figure 7E). To determine whether this decrease in the S100β signal reflected a decrease in the total number of astrocytes, we analyzed the expression of another astrocytic marker, Sox9. The total number of Sox9+ cells increased during the early phase of conversion and later dropped (Figure 7F), but remained higher than that in uninjured areas of the brain (dashed line in Figure 7F). Together, these results suggest that astrocytic properties are drastically changed by NTF overexpression.
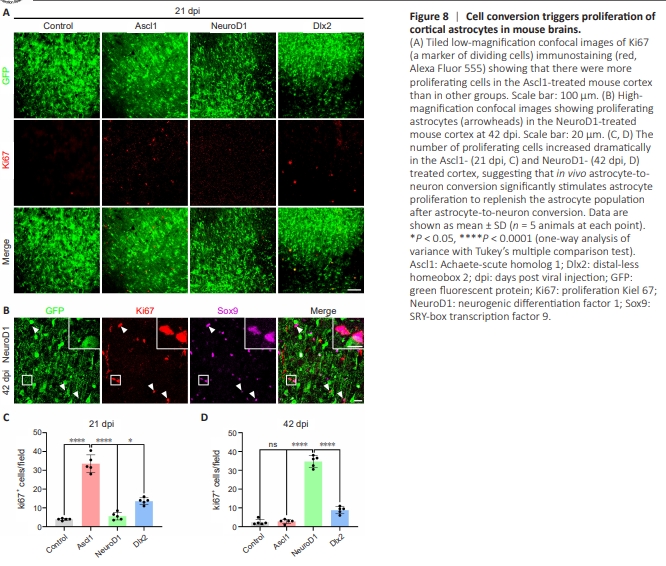
Figure 8 | Cell conversion triggers proliferation of cortical astrocytes in mouse brains.
A serious concern regarding AtN conversion is that astrocytes play important roles in the CNS, particularly in supporting normal neural functions; therefore, if a significant number of astrocytes were converted into neurons, there could be serious side effects. To test this, we examined astrocytic proliferation during AtN conversion by immunostaining for Ki67, a marker of dividing cells. Interestingly, compared with the GFP control group, the number of Ki67+ cells increased significantly in the NTF–overexpressing areas, and the majority of these dividing cells were Sox9+ astrocytes (Figure 8A and B). However, the three NTFs differed significantly in terms of when cell proliferation peaked during the AtN conversion process. Notably, during Ascl1-induced conversion, Ki67+ cell numbers reached a peak at 21 dpi (Figure 8C), whereas during NeuroD1-induced conversion, Ki67+ cell numbers peaked at 42 dpi (Figure 8D), representing a substantial delay compared with Ascl1. Together, these results suggest that astrocytes are not depleted during AtN conversion, but rather can be replenished due to increased proliferation.