脑损伤
-
Figure 2 | Validation of OR-PAM visualized ischemic stroke modeling.

We firstly validated the feasibility of OR-PAM-PT for visualized focal cerebral ischemia modeling. Figure 2A and B show OCTA and OR-PAM images of the cerebral vasculature in a mouse prior to model establishment. The white dotted circle in Figure 2B indicates the selected modeling area with a diameter of 1 mm. As depicted in the images of the modeledarea at different time points in Figure 2C, the dynamic process of vascular obstruction becomes evident. Notably, vessels marked by white arrows at 40 seconds either vanish (as arrows 1 and 2 indicated) or exhibit intermittent presence (as arrows 3 indicated). The signal intensity of several blood vessels begins to decrease, as observed in the case of the vessel denoted by arrows 4. At 60 seconds, the slightly larger vessel begins to narrow in the region pointed out by arrows 5, with the narrowing becoming more pronounced at 80 seconds. Furthermore, we analyzed the profiles along the positions of the blue dashed and blue solid lines at various time points (Additional Figure 1). We determined the full width at half maximum of the profile, as indicated by the arrows in Additional Figure 1, to characterize the vessel diameter. Evidently, there is a noticeable gradual decrease in the signal intensity of the blood vessels, concomitantly leading to a thinning of the vessels due to embolism. To validate the credibility of the ischemic stroke model, we reimaged the whole mouse brain using OCTA and OR-PAM one hour after the modeling procedure. Figure 2D clearly depicts the stroke area, where the vessels have disappeared due to halted blood flow. This observation is further supported by the OR-PAM image in Figure 2E, which also demonstrates a reduction in blood vessels within the targeted region. To provide a more detailed comparison, Figure 2F and G represent enlarged images of the white dashed circle in Figure 2B and E, respectively, displaying the blood vessels before and 1 hour after the modeling process. Integrating the results of OCTA and OR-PAM provides a comprehensive view of the stroke-related changes in blood vessels. While OCTA can only show blood vessels that are actively flowing, the combination with OR-PAM enables the visualization of vessels that have ceased blood flow, as indicated by the red arrow in Figure 2G. In addition to identifying vessels with compromised blood flow, the OR-PAM technique can also reveal specific features like the narrow area in the vessel, which is highlighted by the white arrow in Figure 2G. This level of detail helps in understanding the vascular changes occurring during stroke. The brain tissue after perfusion with physiological saline (Figure 2H) and the TTC-stained brain slice (Figure 2I) show significant areas of ischemic stroke, confirming the reliability of the model.
Figure 3 | Comparison of the modeling process in different aged mice using optical-resolution photoacoustic microscopy.
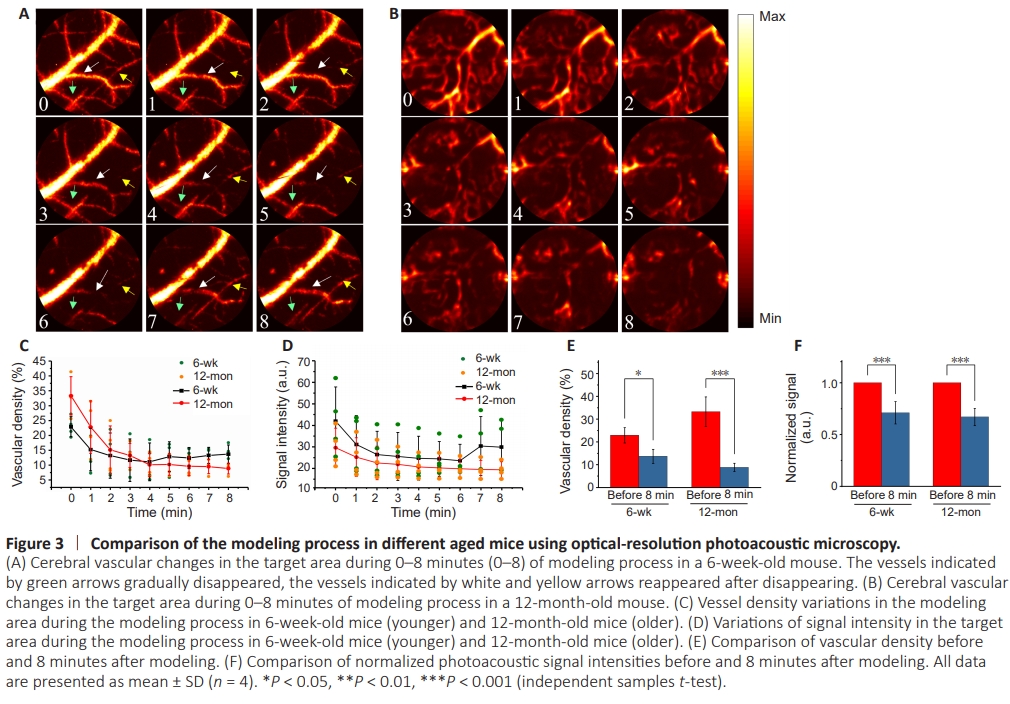
To investigate the different responses of blood vessels during the modeling process in mice of different ages, we performed an 8-minute continuous modeling of the target area and compared the alterations in the modeling area between mice at 6 weeks and 12 months of age. Figure 3A presents the progression of vascular embolism during modeling in 6-weekold mice. The vessels indicated by green arrows gradually fade in intensity or even disappear during the modeling process. Intriguingly, some of the vessels gradually reappeared after disappearing such as the white and yellow arrows indicated. However, in 12-month-old mice (Figure 3B), the blood vessels only gradually disappear during the modeling process without any significant recovery. To further evaluate these observations, we quantified the OR-PAM images obtained from three 6-week-old and three 12-month-old mice to analyze changes in vessel density and signal intensity. As shown in Figure 3C, the vascular density in 6-week-old mice gradually decreased within the initial 5 minutes of modeling and exhibited a slight increase thereafter. In contrast, the vessel density continued to decrease in 12-month-old mice throughout the modeling process. The statistics for the intensity of the vascular signal followed a similar tendency as depicted in Figure 3D. It is noteworthy that the increase in signal intensity at 6 minutes occurred after the recovery of vessel density, suggesting that the signal intensity was still decreasing when few vessel reappearances were observed. Figure 3E and F present significant changes in vascular density and signal intensity after modeling in 6- and 12-month-old mice. These findings highlight the agedependent differences in the response of blood vessels during the modeling process. We postulate that the relatively robust antithrombotic mechanism in young mice may temporarily alleviate the progression of thrombus formation when it initially develops.
Figure 4 | OR-PAM and OCT evaluation of stroke 24 hours after modeling in mice of different ages.
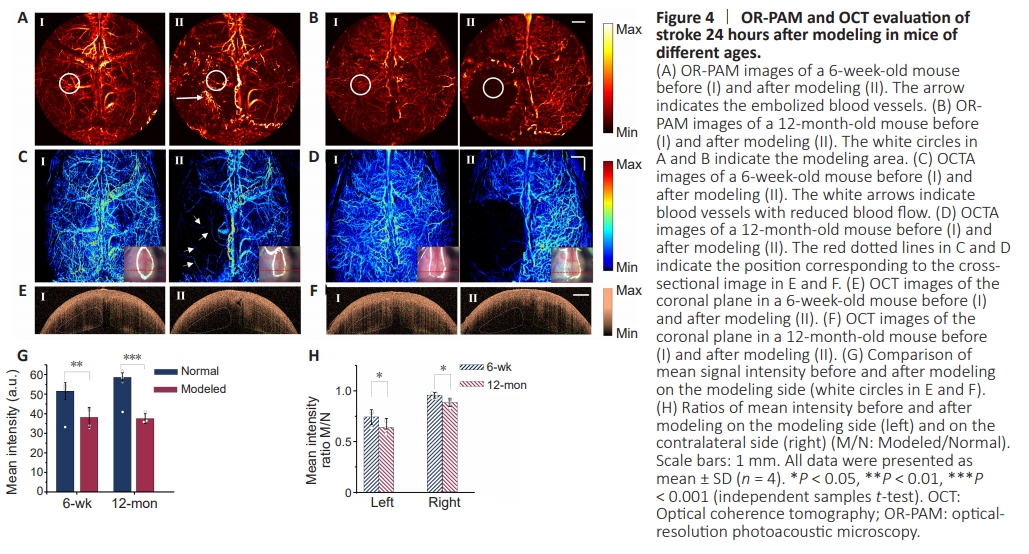
In addition, we compared the cerebrovascular status of three 6-week-old mice (Figure 4A, C, E, and G) and three 12-monthold mice (Figure 4B, D, F, and H) 24 hours after creating the stroke model. Figure 4A and C show variations in cerebral vessels in OR-PAM and OCTA images before and after modeling in 6-week-old mice. Combining OR-PAM and OCTA images allows for easy identification of vessel blockages in Figure 4A, as OR-PAM depicts hemoglobin distribution and OCTA characterizes blood flow. We can conclude that the blood in the white circles in Figure 4A-II has almost stopped flowing and that the white arrows refer to stagnant blood. As marked by the white arrows in Figure 4C-II, a few vessels remain in the modeled area with weak blood flow. However, the hemoglobinin the modeled area disappeared 24 hours after the stroke model was created in 12-month-old mice, as shown in Figure 4B-II. And there are no obvious blood vessels with blood flow crossing the modeled area as shown in Figure 4D-II. The photographs of the brain before and after modeling are inserted in Figure 4A and B, showing significant bruising in the modeled area. In addition, we captured OCT images of the coronal surface of the brain along the red dotted line in the photographs (Figure 4F and H). To evaluate the impact of ischemia on the brain tissue, we calculated the mean OCT signal intensity in the white (target side) and green boxes (contralateral) shown in Figure 4E and F. As shown in Figure 4G, the signal intensity on the modeled sides drops sharply. We further calculated the ratio of the mean signal intensity on the target side and the contralateral side post-modeling to that without modeling. Quantitative results shown in Figure 4H demonstrate that the OCT signal intensity in the target sides of 6- and 12-month-old mice decreased by approximately 55% and 70%, respectively. In addition, signal intensity of the contralateral brain tissue decreased by no more than 10% in 6-week-old mice whereas it decreased by around 20% in 12-month-old mice. It indicates that ischemic stroke causes more severe damage to both the stroke area and the contralateral area in 12-month-old mice.
Figure 5 | Monitoring and analysis of the blood vessels in the cerebral cortex of mice during the self-healing process.

To observe the self-healing process following ischemic stroke in mice of different ages, we monitored the mice for 7 days after modeling. Figure 5A and B are the OCTA results of the recovery process in 6- and 12-month-old mice, respectively. We can clearly see that the blocked vessels disappeared in the figures and black gaps formed. To quantify these changes, we analyzed the vessel density and proportion of stroke area in the stroke hemispheres, indicated by the white boundary in the OCTA images. In Figure 5C, we illustrate the changes in hemispheric vascular density for mice aged 6 weeks. Following the modeling procedure, there was a significant decrease in vascular density, reaching its minimum level on the first day. However, in the 12-month-old mice, significant vascular recovery was evident starting on day 2 post-stroke. Figure 5D shows the stroke area variations during the 7-day self-healing process. In 6-week-old mice, a slight reduction in stroke area was observed starting from one day after modeling. On the other hand, the reduction in stroke area commenced after the second day in 12-month-old mice. Besides, we also found that the signal intensity of the contralateral cerebral vessels changed after stroke occurred in Figure 5A and B, and we performed a quantitative analysis to better characterize this phenomenon. Figure 5E presents the fluctuation of vascular intensity in contralateral brain regions of mice of different ages. It demonstrates that the signal intensity in the contralateral brain region increased and then decreased to normal levels in 12-month-old mice, while in younger mice, the signal intensity increased, then decreased, and finally rebounded to normal levels. The mechanism of this phenomenon warrants further in-depth investigation. The OR-PAM images taken 7 days after modeling provide a different perspective on the embolism recovery process. As shown in Figure 5F, there is obvious congestion in the stroke area, and the congestion gradually fades during the recovery process in 6-week-old mice. Figure 5G shows a different recovery period in 12-month-old mice. There is almost no PA signal in the modeled area once the model is created. The signal gradually returned to the pattern shown in the white circle. Additionally, the PA signal intensity in the contralateral brain regions was affected after stroke modeling. As shown in Figure 5H, the PA signals in the contralateral brain regions of 6-week-old mice gradually increased, whereas they first increased and then decreased in 12-month-old mice. We speculate that the contralateral cerebral vessels have to carry more hemoglobin to compensate for the reduced perfusion caused by thrombosis.