神经损伤与修复
-
Figure 1 | Hearing loss and hair cell damage by kanamycin and furosemide administration.
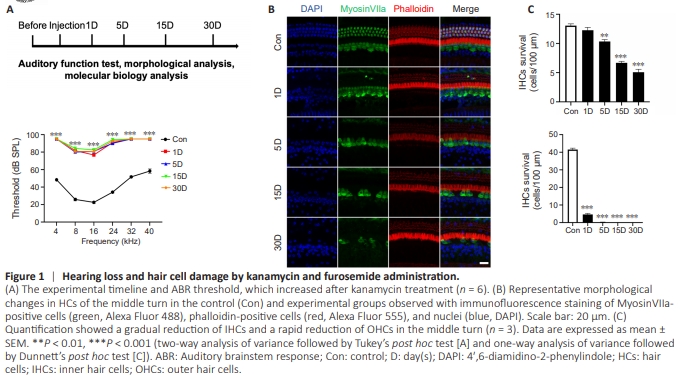
To evaluate auditory function, ABR tests were performed before and 1, 5, 15, and 30 days after kanamycin administration (Figure 1A). The thresholds were lifted to 81.67 ± 1.67, 76.67 ± 1.05, and 90.83 ± 1.54 dB SPL at 8, 16, and 24 kHz, respectively, in the 1 D group compared with the control group (all P < 0.001). At 4, 32 and 40 kHz, no reaction to sound was detected, even with the most intense stimulus. The loss of function was irreversible; no recovery was observed after 5, 15, or 30 days. To further investigate HC alterations, myosin VIIa was used to visualize cellular structure on whole-mount basilar membranes (Figure 1B). The extent of HC loss was similar to that reported in previous studies (Hu et al., 2017; Ye et al., 2019), with a rapid decrease of OHCs and a gradual decrease of IHCs (Figure 1C).
Figure 2 | Degeneration of SGNs after kanamycin administration.
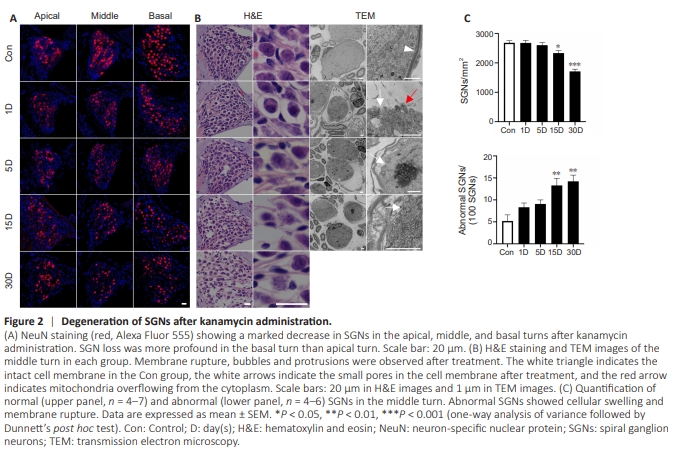
To investigate SGN alterations, NeuN staining was used to visualize cells in cross-sections. No obvious SGN loss was observed after 1 day, but the number of SGNs began to decrease in the 5 D group compared with the control group, and a significant difference occurred in 15 D group compared with the control group. SGN loss was more profound in the basal turn than in the apical turn (Figure 2A). At each time point, cochleae from at least three animals were collected for H&E staining, and two were collected for transmission electron microscopy (TEM) analysis (Figure 2B). At 15 and 30 days, only 87.0% and 63.8% of the SGNs remained in the middle turn of Rosenthal’s canal, respectively (Figure 2C). We observed that the spaces between the densely packed SGNs and surrounding satellite cells began to increase after 1 day (Figure 2B). Further, observations with TEM showed that the gaps between the SGNs and satellite cells were increased, myelin sheaths were disrupted, bubbles appeared in the cytoplasm and cell membranes, and organelles were spilled out. At 5 days, several SGNs showed an irregular membrane and swelling of the cell body, although the nuclei remained relatively normal (Figure 2B). The condensing and wrinkling effects seen in apoptosis were not observed. Membrane rupture, which is a sign of pyroptosis, was identified in TEM images in the 5 D and 15 D groups. Bubbles and protrusions were observed in the 15 D and 30 D groups in cross-sectional views of the cochlea. SGNs that were swollen, showed protrusion, or lacked membrane integrity were counted. The number of these abnormal SGNs increased gradually over 30 days (Figure 2C), indicating that non-apoptotic cell death may have occurred during SGN degeneration.
Figure 4 | Upregulation of pyroptosis- and inflammasome-related genes associated with SGN degeneration.
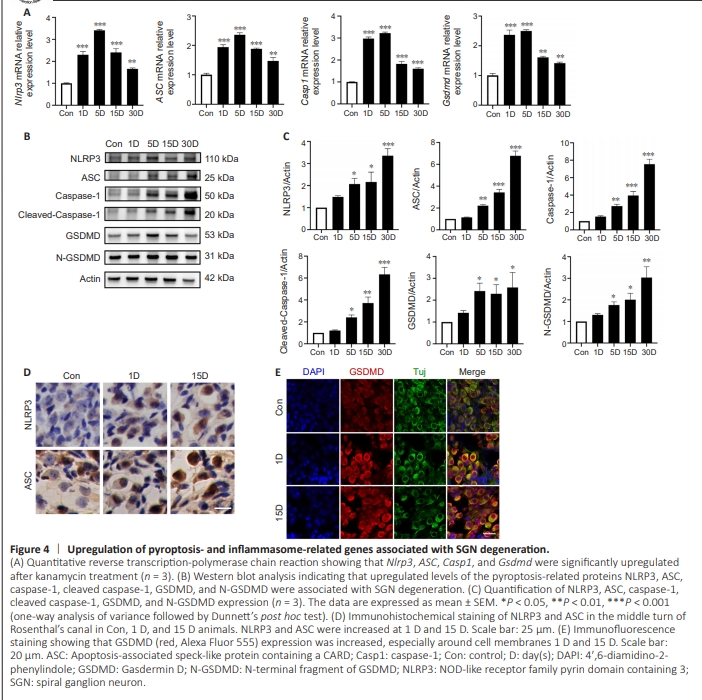
Previous studies have shown that the NLRP3 inflammasome plays critical roles in the central nervous system, especially in the context of neurodegenerative diseases (Duan et al., 2020; Ismael et al., 2021; Wang et al., 2022b, 2023; Cui et al., 2023). In our model, the mRNA levels of Nlrp3, ASC, and caspase-1 were all elevated and reached their highest levels on day 5 (Figure 4A). At 30 days, the transcriptional levels of these key proteins in the pyroptosis pathway remained higher than those in the control group (P < 0.01). Immunoblotting confirmed that NLRP3, ASC, and caspase-1 expression was significantly increased in the 5 D group and remained at a higher level in the 30 D group compared with that in the control group, suggesting activation of the pyroptosis pathway (Figure 4B and C). The increased levels of NLRP3 and ASC at 1 and 15 days were confirmed by immunohistochemical staining (Figure 4D). Taken together, these results indicated marked canonical pyroptosis pathway activation. Moreover, GSDMD transcription increased sharply after kanamycin exposure, peaking at 5 days and declining thereafter (but remaining higher than in the control group; Figure 4A). We analyzed the protein levels of the N-terminal fragment of GSDMD and intact GSDMD and confirmed that their levels increased gradually over time, and were highest at 30 days (Figure 4C). Immunofluorescence staining showed GSDMD accumulation in the SGN membrane after kanamycin administration (Figure 4E). Furthermore, qPCR showed that Tlr2, Tlr4 and Myd88 expression levels were significantly increased after kanamycin treatment, which may directly modulate the NLRP3-induced inflammatory response (Additional Figure 1).
Figure 5 | Increased release of IL-1β and IL-18 after kanamycin treatment.
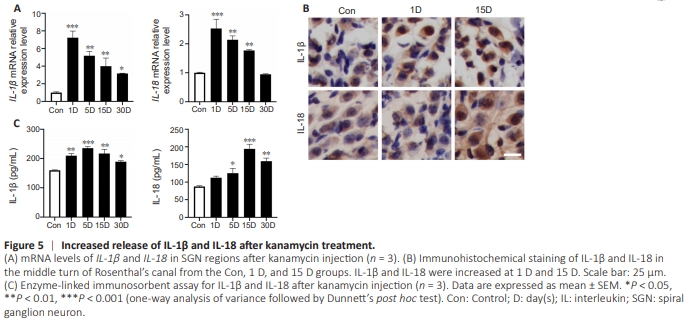
Inflammasome activation leads to the activation and release of IL-1β and IL-18 (Huang et al., 2021; Sai et al., 2022; Xu and Nú?ez, 2023). We next investigated changes in effector cytokines during kanamycin-induced SGN degeneration. The mRNA levels of IL-1β and IL-18 were increased sharply in the 1 D group and decreased thereafter (Figure 5A). The increased expression of IL-1β and IL-18 seen at 1 and 15 days was confirmed by immunohistochemistry (Figure 5B). Moreover, enzyme-linked immunosorbent assay showed that the IL1β protein level peaked in the 5 D group and then gradually decreased, whereas IL-18 expression peaked in the 15 D group (Figure 5C). For both proteins, the levels did not decrease to those of the control group by 30 days. In summary, IL-1β and IL-18 were increased, which suggests that they were involved in the process of SGN neuroinflammation after kanamycin administration.
Figure 6 | Macrophage recruitment and activation in the SGN region after kanamycin treatment.
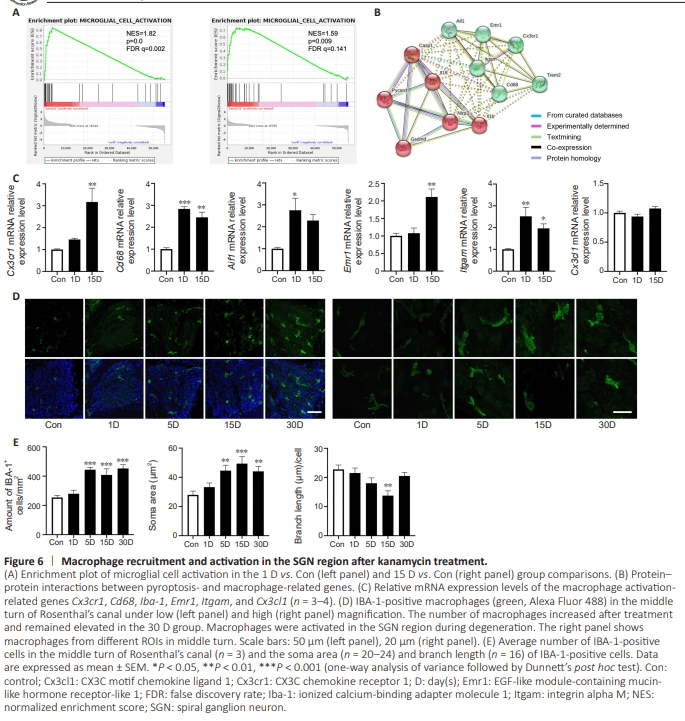
As the primary cells sensing environmental changes in the cochlea, macrophages play an important role in damage and repair processes (Kaur et al., 2015; Brown et al., 2017; Wang et al., 2021c; Manickam et al., 2023; Sung et al., 2023). Gene set enrichment analysis of the RNA sequencing data indicated that the microglia activation-related pathway was triggered at 1 and 15 days after kanamycin administration (Figure6A). Furthermore, we found a close association between pyroptosis- and macrophage-related genes, as indicated by protein–protein interaction network analysis (Figure 6B). Finally, the macrophage-related genes Cx3cr1 (also known as CX3C chemokine receptor 1), Cd68 (a heavily glycosylated glycoprotein highly expressed in macrophages), Iba-1 (ionized calcium-binding adapter molecule 1, also known as allograft inflammatory factor 1), Emr1 (EGF-like module-containing mucin-like hormone receptor-like 1, also known as F4/80), and Itgam (integrin alpha M, also known as CD11b) in 15D group were upregulated about 3-fold compared with those in control group SGNs. No change in Cx3cl1 (also known as CX3C motif chemokine ligand 1) expression was found (Figure 6C). Next, we assessed IBA-1 expression for quantitative and qualitative analysis of macrophages in the SGN region (Figure 6D). Cochlear cross-sections were used for macrophage analysis. In the 5 D group, the number of macrophages was increased 1.75-fold compared with that in the control group, and macrophage number remained elevated at 30 days (Figure 6E), which suggested consistent engraftment during SGN degeneration. Whole-mount preparations confirmed that macrophage expression was increased in both the osseous spiral lamina and SGN regions (Additional Figure 2). Previous studies have reported that activated macrophages are ameboid in shape, unlike inactivated, ramified macrophages (Sun et al., 2015; Brown et al., 2017). We measured the soma size and length of the branches of each macrophage. The soma area was enlarged (1.78 times larger than that in the control group) in the 15 D group, whereas the branches were shorter in the 15 D group but had recovered in the 30 D group compared with the control group (Figure 6E). The engraftment and enlargement of the soma of macrophages indicated macrophage activation in the SGN region during degeneration, similar to what has been reported in previous studies (Fujioka et al., 2006; Tornabene et al., 2006; Tan et al., 2016). In addition, macrophages engulfing beta-III tubulinpositive debris were observed (Additional Figure 3).
Figure 7 | SGN protection and reduced expression of pyroptosis-related molecules after NLRP3 inflammasome inhibition.
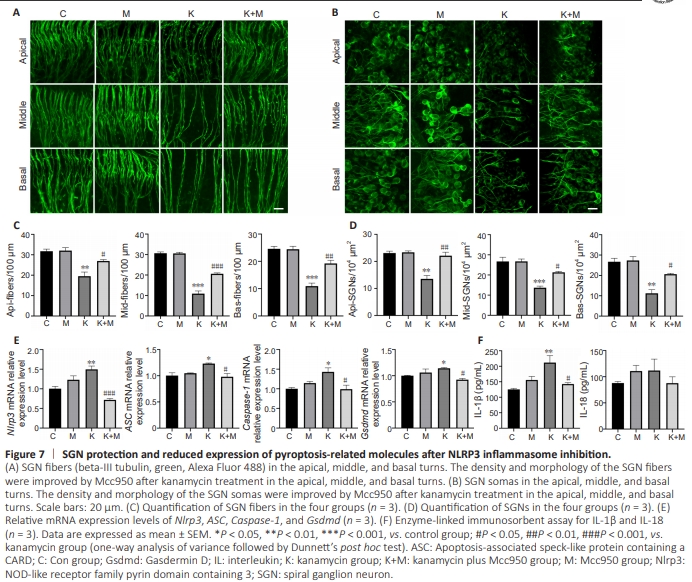
Mcc950 is a specific inhibitor of the NLRP3 inflammasome that directly targets the ATP-hydrolysis motif without affecting other PRRs such as NLRC4, NLRP1, and AIM2 (Coll et al., 2015; Li et al., 2022a). We applied Mcc950 with kanamycin to inhibit NLRP3 in cochlear organ explants. To assess the integrity of the peripheral neurons, we used antibodies against beta-III tubulin as a marker of SGNs (Hallworth and Ludue?a, 2000; Bostr?m et al., 2007; Di Santo et al., 2014) and their nerve fibers (terminating in HC regions). The loss of SGN fibers was largely ameliorated by coadministration of Mcc950 and kanamycin (compared with the reduction seen in the apical, middle, and basal turns in the group treated with kanamycin alone; Figure 7A). The density and morphology of the SGN somas at the apical, middle, and basal turns were improved by coadministration of Mcc950 and kanamycin compared with the kanamycin alone group (Figure 7B). Quantitative analysis of fibers and SGNs supported the protective effects of Mcc950 in the apical, middle and basal turns (Figure 7C and D). The qPCR results indicated that Nlrp3 (P < 0.001), ASC (P = 0.012), caspase-1 (P = 0.015), and GSDMD (P = 0.013) were markedly decreased by Mcc950 (Figure 7E), suggesting that NLRP3 inflammasome inhibition led to reduced caspase-1 expression. The effector cytokines IL-1β and IL-18 were greatly reduced after NLRP3 inhibition (Figure 7F). The above results indicate that NLRP3 is an important target for the treatment of SGN degeneration.
Figure 8 | Knockout of Nlrp3 delays SGN degeneration after kanamycin and furosemide administration.
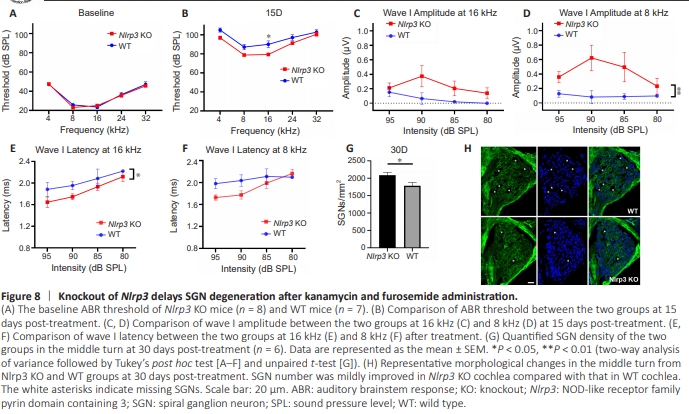
To verify how the deletion of NLRP3 affects SGN survival in vivo, we administered kanamycin to Nlrp3 KO mice and compared the auditory function before and 15 days after the treatment. There was no significant difference in SGN density between KO and WT mice without any treatment (Additional Figure 4). The auditory function was comparablebetween the KO and WT groups before treatment at all test frequencies from 4 kHz to 32 kHz (Figure 8A), indicating that NLRP3 deletion did not affect auditory function. On day 15, hearing thresholds were elevated in both groups. However, the thresholds in the Nlrp3 KO mice were much lower than those in WT mice, suggesting better hearing function, especially at 8 and 16 kHz in the Nlrp3 KO mice (Figure 8B). We further evaluated the suprathreshold function at 16 and 8 kHz. The amplitude of wave I was higher in KO mice than WT mice, in addition to the steeper slope of the input/output wave I amplitude curve we observed in the KO group (Figure 8C and D). Additionally, the latency of wave I was shorter in KO mice than in WT mice (Figure 8E and F). The better suprathreshold auditory function in KO mice suggested better neuronal synchronization of the SGNs. We next quantified the healthy and remaining SGNs in the Rosenthal’s canal in frozen sections at the middle turns of the cochlea. SGN survival was significantly improved in the auditory nerve of KO cochlea compared with WT cochlea, although mild (Figure 8G and H), which is consistent with the functional improvement.