脊髓损伤
-
Figure 2 | Validation of the necroptosis model and characterization of NSCs and exosomes.

To characterize the exosomes released subsequent to necroptosis in NSCs, we isolated NSCs, induced necroptosis, and collected the exosomes released by the NSCs. The NSCs formed neurospheres in vitro that exhibited a typical spherical shape and refractive index (Figure 2A). Both the neurospheres and individual cells express the NSC markers SOX2 and Nestin (Figure 2B). TSZ treatment induced NSC necroptosis that was characterized by a notable rise in the count of PI-positive and caspase-8–negative cells (Figure 2C). Exosomes from both the control and TSZ groups exhibited a classical “Teato-like” (semiconcave on one side) bilayer membrane structure, as observed by transmission electron microscopy. Furthermore, nanoflow analysis showed that these exosomes demonstrated particle sizes ranging from 50 to 150 nm, with a concentration of 4.48 × 10⁹ particles/mL in the control group and 5.1 × 10⁹ particles/mL in the TSZ group (Figure 2D and E). We validated the expression of the three surface markers CD9, CD63, and CD81 on exosomes via nanoflow analysis and observed that CD9 expression was the highest among the three markers in both the control and TSZ groups, followed by CD81 (Figure 2F).To investigate the impact of necroptosis on the NSC-derived exosome transcriptome, we conducted RNA sequencing of exosomes obtained from both the control and TSZ groups, performed Venn diagram analysis (Additional Figure 1A), and analyzed the differential expression of messenger RNAs (DEmRNAs), lncRNAs (DElncRNAs), circular RNAs (DEcircRNAs), and miRNAs (DEmiRNAs). We identified 108 DEmRNAs (60 down-regulated and 48 up-regulated), 104 DElncRNAs (55 down- regulated and 49 up-regulated), 720 DEcircRNAs (253 down- regulated and 647 up-regulated), and 14 DEmiRNAs (9 down- regulated and 5 up- regulated) (Additional Figure 2A). Clustering maps of the DEmRNAs, DElncRNAs, DEcircRNAs, and DEmiRNAs indicated clear differentiation between the control and TSZ samples (Additional Figure 1B). The top 20 KEGG pathways enriched in DEmRNAs, as well as target genes of the DEmRNAs, DElncRNAs, and DEcircRNAs, are presented as bubble plots in Additional Figure 2B–D. Among them, the “Ubiquitin-mediated proteolysis” and “Autophagy” pathways were significantly enriched in DEmRNAs, DElncRNAs, and DEcircRNAs. The “Thermogenesis” and “Spliceosome” pathways were significantly enriched in DEmRNAs and DElncRNAs. The “Neurotrophin signaling pathway” was significantly enriched in DEmRNAs and DEcircRNAs. Additionally, the “Chronic myeloid leukemia” pathway was significantly enriched in DEcircRNAs, while only the “MAPK signaling pathway” was significantly enriched in DEmiRNAs.
Figure 4 | Western blot and immunofluorescence analysis of the expression of proteins encoded by hub genes in the spinal cord 3 days following injury.
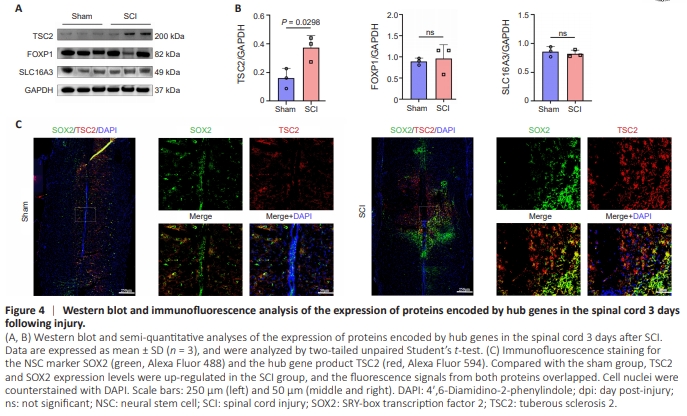
Western blot analysis showed a substantial increase in TSC2 expression in spinal cord tissues from the SCI group compared with the sham group (P = 0.0298). Conversely, FOXP1 and SLC16A3 expression levels did not change significantly (Figure 4A and B). Immunofluorescence analysis of spinal cord tissues showed a marked increase in the number of SOX2-positive cells in the SCI group compared with the sham group, and these cells were concentrated in close proximity to the injury site. We observed a concurrent increase in the number of TSC2- positive cells within the injury zone. These findings suggest that exosomes secreted by endogenous NSCs upregulated TSC2 expression in exosome receptor cells (Figure 4C).Next, we conducted ligand-receptor pair analysis to analyze cellular communication among all cells in the control group and at three time points after SCI (Additional Tables 6–9). Cellular communication was observed between ependymal cells and all cell types (including other ependymal cells) at all time points (Additional Figure 4). Ependymal cell communication with astrocytes and OPCs was stronger in the control group than in the SCI groups. At 1 day postinjury (dpi), almost all cellular communication decreased to similar levels. At 3 dpi, cellular communication was stronger
Figure 5 | Western blot and immunofluorescence analyses of TSC2 expression after uptake of exosomes derived from TSZ-treated NSCs in vitro.
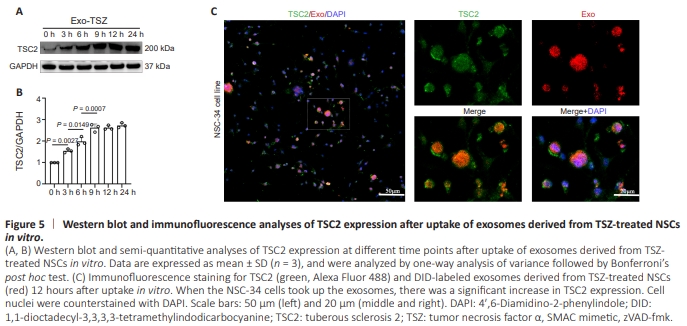
Next, we performed an in vitro uptake assay in which NSC-34 cells were exposed to exosomes secreted by NSCs undergoing necroptosis (1 × 10⁹ particles/mL, equivalent to adding 196 μL of exosomes to 1 mL of exosome-free medium). We then measured TSC2 expression following direct cellular uptake of exosomes derived from TSZ-treated NSCs. Western blot analysis showed a significant increase in TSC2 expression during the first 9 hours post–exosomes uptake in vitro. Conversely, no notable change in TSC2 expression was observed from 9 to 24 hours after exosome uptake (Figure 5A and B). Furthermore, immunofluorescence analysis showed that the TSC2 fluorescence intensity was more pronounced 12 hours after exosome uptake in cells that had taken up a larger quantity of exosomes (red, 1,1-dioctadecyl-3,3,3,3- tetramethylindodicarbocyanine–labeled) (Figure 5C).