脑损伤
-
Figure 1 | Characterization of cellular proportions and morphologies in control (uninjured) cultures at 8 days in vitro.
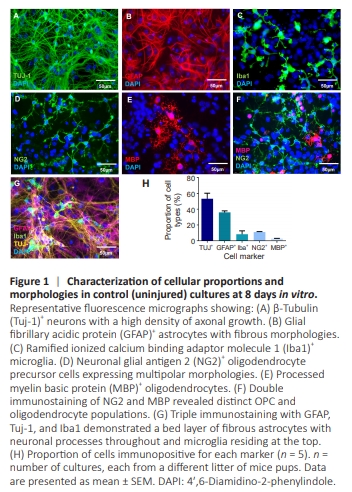
To assess the cellular distribution of our cortical dissociate cultures, we performed immunostaining using various neural cell markers. The morphological analysis combined with double and triple cell staining revealed a dense neuronal network, fibrous elongated astrocytes, ramified microglia, and multipolar oligodendrocytes and OPCs (Figure 1A–G).
Figure 2 | Reproducible induction of transecting lesions.
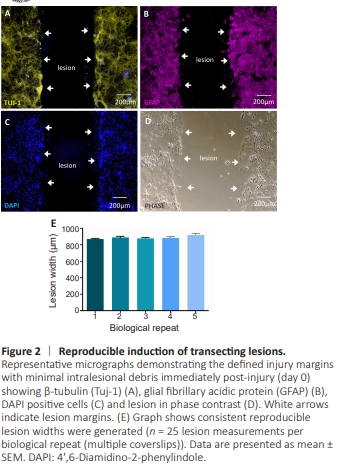
To assess if consistent lesions could be generated across biological replicates, we measured the lesion width across multiple technical replicates. At 7 DIV, focal injury lesions produced clear injury margins with minimal intra-lesional debris (Figure 2A–D). The average lesion width at 0 DPL was 878.4 ± 6.2 μm (Figure 2E).
Figure 3 | Characterization of astrogliosis at the lesion site.
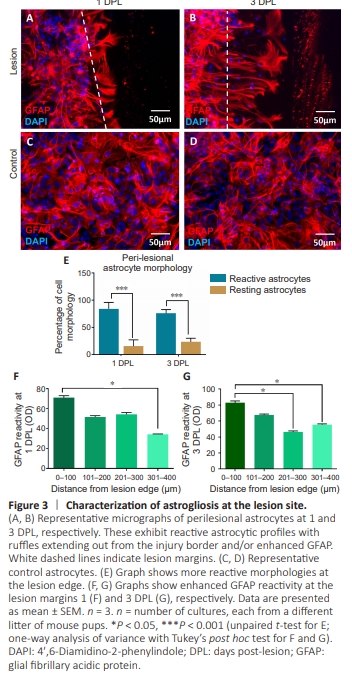
To establish if the model demonstrated injury-induced astrogliosis, astrocyte morphology and GFAP expression were evaluated at the injury site. Here, hypertrophic reactive astrocytes palisaded lamellipodial extensions into the lesion cavity, forming a glial scar–like astrocytic web with increased levels of GFAP expression (Figure 3A and B). Control resting astrocytes exhibited processed fibrous phenotypes with fewflat polygonal morphologies (Figure 3C and D). Peri-lesional astrocytes (0–100 μm from lesion edge) presented mostly reactive morphologies (hypertrophic and/or extending ruffles) on days 1 and 3 compared with resting astrocyte phenotypes (fibrous/processed/fusiform) (P < 0.001; Figure 3E). In addition, peri-lesional astrocytic GFAP immunoreactivity was significantly elevated at 1 and 3 DPL versus astrocytes present at 301–400 μm from the lesion edge (P < 0.05; Figure 3F and G). Although an overall significant difference was observed, it was noted that both the degree and extent of GFAP immunoreactivity were not uniform across the lesion site. There was no difference between injury-induced GFAP expression at 1 and 3 DPL.
Figure 4 | Injury-induced microglial activation.

To assess whether our model could accurately replicate microglial activation as observed in vivo, we performed immunostaining to study microglial activity and distribution within the lesion site. Penetrating injury consistently induced reactive microgliosis. Iba1+ microglia infiltrated the lesion, with a significant increase in densities from 1 DPL to 3 DPL (P < 0.05; Figure 4A, B, and E). Intralesional microglia exhibited distinct amoeboid hypertrophic morphologies (Figure 4A and B), whereas microglia distant from the injury site (distal) continued to display ramified morphologies (Figure 4C and D). Typical amoeboid and ramified morphologies quantified are shown in Figure 4F.
Figure 5 | Characterization of neuronal and OPC responses in lesion sites.
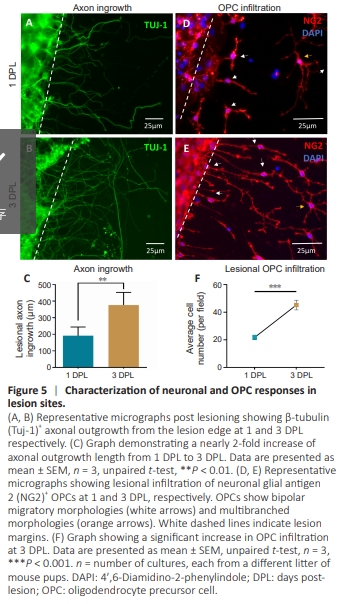
To evaluate axonal injury/regeneration and post-injury OPC infiltration into lesions, as observed in vivo, we performed immunostaining to study axonal/OPC responses. Clear axonal transection with well-defined lesion margins was observed (Figure 5A). Axonal outgrowth from the lesion edges was detected as early as 1 DPL, with an average extension of 211.86 ± 23.37 μm (Figure 5A). By 3 DPL, axonal outgrowth nearly doubled, reaching 394.40 ± 29.34 μm (Figure 5B), a significant increase compared to 1 DPL (P < 0.01; Figure 5C). Concomitantly, intra-lesional NG2+ OPC infiltration increased significantly, more than doubling from 1 DPL to 3 DPL (Figure 5D–F), with cell density rising from 21.8 ± 1.7 cells/mm2 to 45.3 ± 3.5 cells/mm2 (P < 0.001; Figure 5F). Migratory bipolar OPC profiles were evident within the lesion area at both 1 and3 DPL (Figure 5D and E), along with non-migratory multipolar profiles (Figure 5D and E), indicating active OPC migration into the injury site. Notably, there was no evidence of OPC nuclear doublets, suggesting the absence of OPC proliferation within the lesion area.
Figure 6 | Activated astrocytes, neurons, or OPCs within or pro0ximal to the lesion site do not show obvious uptake of PEG/ CMX MPs.
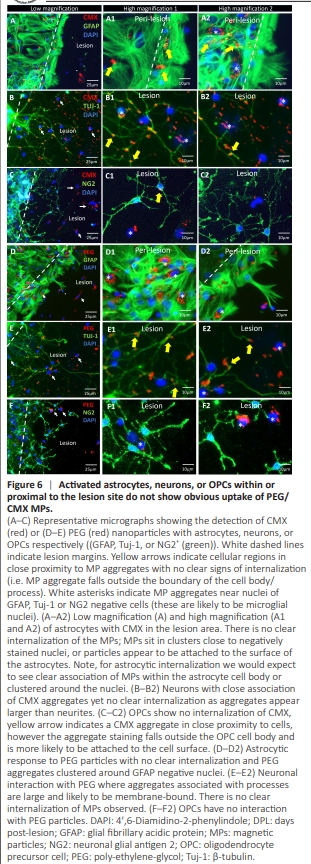
Figure 7 | Competitive MP uptake in injury-activated microglia at 3 DPL.
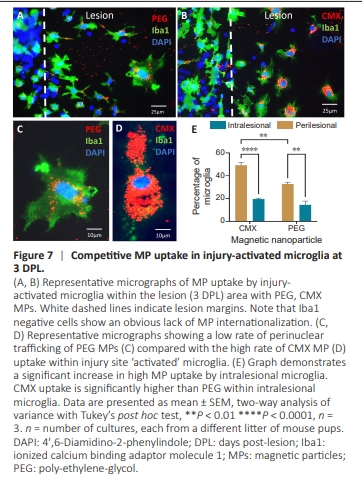
To evaluate the suitability of our injury model for biomaterial testing, including the ability to replicate known cellular responses to MPs, we introduced PEG and CMX MPs immediately post-injury. High MP accumulations in lesions were consistently associated with cells negative for astrocyte, neuron, or OPC markers. Cellular regions in close proximity to MP aggregates showed no clear signs of internalization (i.e., the MP aggregate falls outside the boundary of the cell body/process), therefore these aggregates are more likelyo be membrane-bound rather than internalized (Figure 6). Note there are also MP aggregates that are non-specifically bound to the coverslips. MPs showed clear co-localisation to the nuclei of infiltrating microglia (Figure 7A and B). At 3 DPL, injury-activated microglia demonstrated greater uptake of CMX versus PEG MPs with evidence of peri-nuclear MP trafficking (Figure 7C–E). In addition, intralesional microglia demonstrated significantly greater levels of MP uptake versus peri-lesional microglia (P < 0.001; Figure 7E).
Figure 8 | Histological and electrophysiological characterization of cultures using extracellular MEA recordings.
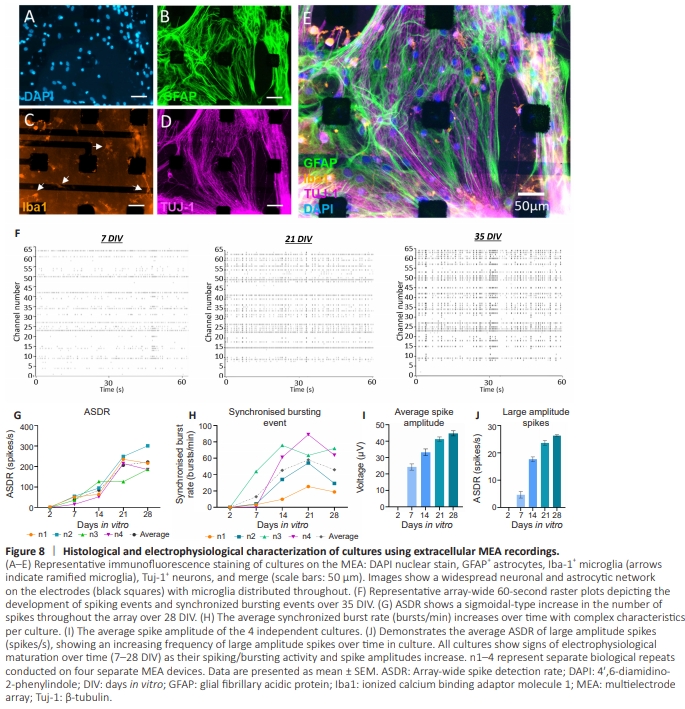
To ensure neurons, astrocytes, and microglia displayed normal phenotypes in MEA cultures at 35 DIV, a quadruple stainingwas performed (Figure 8A–E). Micrographs show evidence for the maintenance of the multicellular 2D culture. GFAP+ astrocytes displayed fibrous elongated resting morphologies. Tuj-1+ staining showed an extensive neuronal network (with many neurites passing over individual electrodes). Microglial staining (Iba1+ ) showed both ramified and amoeboid morphologies. These data indicate that normal morphologies are maintained following culture on MEA devices, including an extensive neuronal network. Raster plots (Figure 8F) revealed the change in the array-wide neuronal spike behaviors from 7 to 35 DIV. These demonstrate a clear increase in spiking events and global network bursting synchrony over time in culture. Activity at 7 DIV is sporadic and unorganized but by 35 DIV, signals are dominated by synchronized bursting events showing the development of network activity in these complex cultures. The ASDR, synchronized neuronal burst rates, and spike amplitude at the different time points were quantified and compared. The ASDR follows a general upwards trend over time in culture, reaching 222 ± 27.3 spikes/s at 28 DIV from 0.9 ± 0.6 spikes/s at 2 DIV (Figure 8G), with substantial maturation in ASDR occurring between 7 and 21 DIV. These ASDR data sets from the separate cultures display a relatively uniform development profile over time. However, in terms of synchronized burst rate development over days in vitro, each culture displays a unique pattern (Figure 8H). Despite variation being observed across biological repeats, there was a general upward trend of increased synchronized burstingover time in culture. The greatest increase in global synchrony events was observed between 7 and 21 DIV. Lastly, average spike amplitude increased over time in culture (Figure 8I), in particular the rate of large amplitude spikes which showed a dramatic increase between 7 and 14 DIV (Figure 8J).
Figure 9 | Proof of concept of evaluating post-injury changes in electrical activity on the MEA.
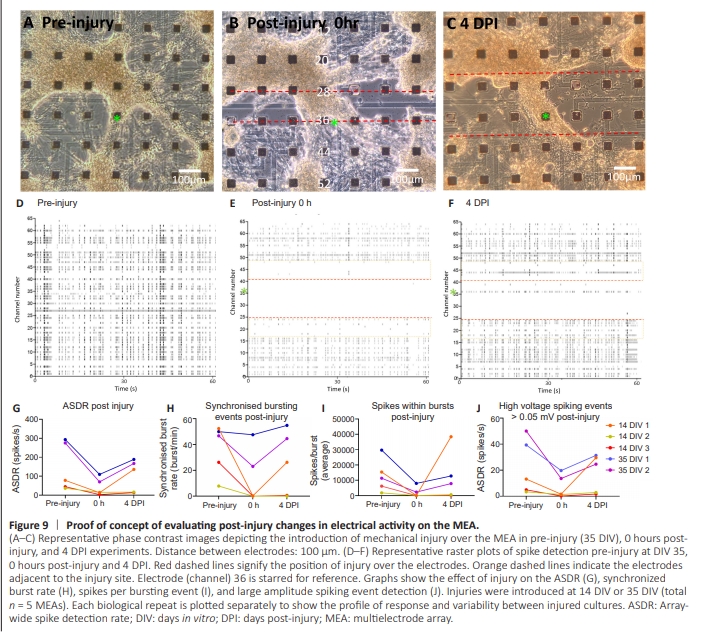
To adapt our model to a functional readout platform, we established a method for inducing transection injuries in situ on MEAs, and conducted electrophysiological characterization of the culture over time. This approach aimed to enable integrated histological and electrophysiological analyses following biomaterial application at the injury site. In proofof-concept experiments, the introduction of a focal injury at the cortical culture-MEA interface allowed for the detection of neuronal electrical activity post-injury induction (Figure 9A– C). These injuries were performed at DIV 14 (n = 3) and DIV 35 (n = 2). Data shown in Figure 9A–F is representative of the 35 DIV culture. Electrophysiological activity was diminished or lost within the injury site (example data shown in Figure 9E). Concomitantly, electrodes adjacent to the injury site showed a reduction in spiking activity, but signals continued to be detected in the non-lesion areas; this varied across MEAs. Four days after the initial injury, recovery of electrical activity could be detected. In the example shown, activity within the injury site remained diminished with the exception of channel 36 where a remnant section of tissue connected the two sidesof the injury (Figure 9F). Quantified data from the 5 MEAs are plotted separately in graphs (Figure 9G–J) to demonstrate the pre- and post-injury electrical profiles across MEAs. While there was variability between MEAs, all devices interfaced with injured cultures showed a broadly similar profile of alterations in electrical activity across the MEA after injury. The injury induced a reduction in ASDR (Figure 9G), which is more apparent in the 35 DIV cultures that have higher preinjury ASDRs. Cultures regained some activity by 4 DPI, with one culture at 14 DIV recovering activity to higher than preinjury levels. The effect of injury on synchronized burst events was age and culture-dependent but was reduced by the initial injury, with some evidence of synchrony recovering by 4 DPI, particularly in older cultures (Figure 9H). The number of individual spikes within these synchronized bursting events also dropped as a result of initial injury with evidence of a rise by 4 DPI (Figure 9I). Lastly, larger amplitude spikes were dramatically reduced at the time of injury and showed some recovery after 4 DPI (Figure 9J).