脑损伤
-
Figure 1 | Endogenous BRD4 expression after SAH.
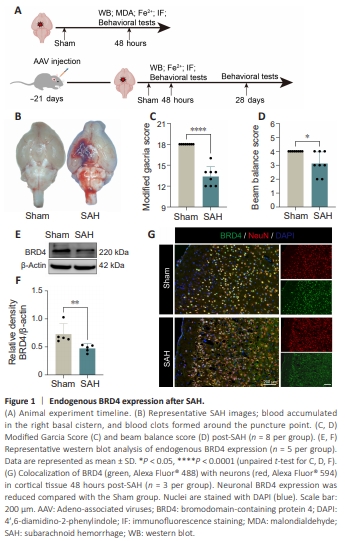
To detect endogenous BRD4 protein levels after SAH, a mouse model of SAH was established using the modified single clip method, which allows blood to accumulate in the subarachnoid space. This causes the respiratory rate of the mouse to slow down, and can even cause brief apnea; this is called CheyneStokes respiration and is a typical manifestation of Cushing’s response. As shown in Figure 1B, significant hematoma was observed in the SAH group, but not in the Sham group. Neurological deficits were evaluated using the modified Garcia score and the beam balance test at 48 hours following SAH. SAH induced significant neurological deficits (modified Garcia score, P < 0.0001, Figure 1C; beam balance test, P < 0.05, Figure 1D) compared with the Sham group. Next, we collected ipsilateral cerebral cortex tissues and performed western blot analysis to detect BRD4 expression. As illustrated in Figure 1E and F, endogenous BRD4 expression in the SAH group was clearly reduced at 48 hours compared with the Sham group (P < 0.05). Furthermore, double immunofluorescence staining (IF) revealed that BRD4 predominantly colocalized with neurons (NeuN) in the cerebral cortex, and that BRD4 expression was decreased (Figure 1G). These findings suggest that BRD4 plays a protective role after SAH.
Figure 2 | Ferroptosis-related pathways are activated after SAH.
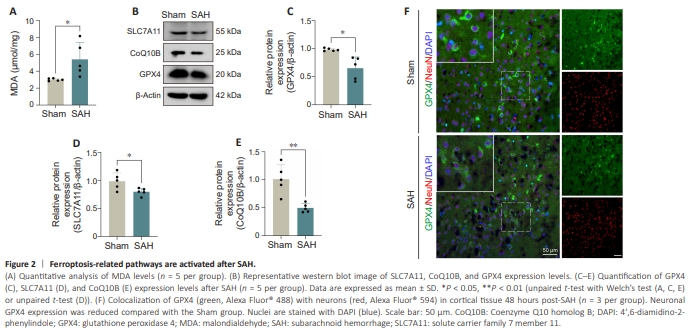
To assess the activation status of ferroptosis-related pathways following SAH, we collected ipsilateral cerebral cortical tissue and detected the expression of ferroptosis-associated markers by western blotting and immunofluorescence staining and so on. MDA expression was significantly higher in the SAH group than in the Sham group at 48 hours after injury (P < 0.05; Figure 2A). Furthermore, western blot analysis showed that the expression of GPX4, a classical ferroptosis marker (Yang and Stockwell, 2016), was decreased in the SAH group compared with the Sham group (P < 0.05; Figure 2B and C), which was consistent with the observed increase in MDA expression. SLC7A11 (also known as xCT), a key component of the xc– cystine/glutamate antiporter system, participates in the GPX4-mediated anti-ferroptosis pathway (Yang and Stockwell, 2016), and its expression was decreased in the SAH group compared with the Sham group (P < 0.05; Figure 2B and D). In addition to the canonical GPX4-dependent anti-ferroptosis mechanism, the ferroptosis suppressor protein 1/CoQ10 antioxidative system confers protection against ferroptosis (Bersuker et al., 2019), and SAH significantly decreased CoQ10B expression compared with the Sham group (P < 0.01; Figure 2B and E). Finally, IF staining indicated that the GPX4 colocalized with cortical neurons (NeuN), and its expression was dramatically suppressed in the SAH group (Figure 2F). Thus, SAH activated ferroptosis-related pathways to promote ferroptosis.
Figure 3 | OxyHb suppresses BRD4 expression and activates ferroptosis-related pathway in HT-22 cells.
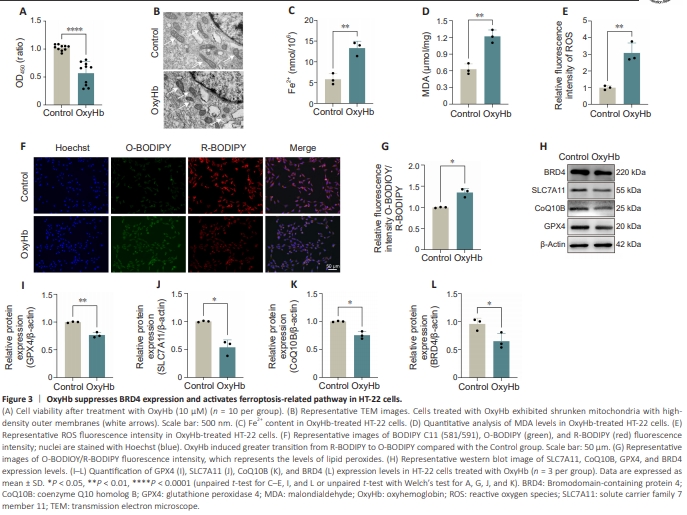
To mimic neuronal injury following SAH in vivo, we treated HT-22 cells with 10 μM OxyHb in vitro and assessed cell viability by CCK8. As shown in Figure 3A, treatment with OxyHb significantly decreased HT-22 cell viability (P < 0.0001). To determine whether ferroptosis occurs in HT-22 cells, we next analyzed the presence of a series of ferroptosis-related indicators. Transmission electron microscopy showed significant shrinkage of mitochondria accompanied by the presence of high-density outer membranes in OxyHb-treated HT-22 cells compared with the Control group (Figure 3B). Additionally, there was a notable accumulation of Fe2+ in the OxyHb group (P < 0.01; Figure 3C), and OxyHb treatment significantly increased the MDA content compared with the Control group (P < 0.01; Figure 3D). Detection of DCFH-DA, a marker of intracellular ROS (Rajneesh et al., 2017), demonstrated elevated levels of oxidative stress within the OxyHb group in comparison with the Control group (P < 0.01; Figure 3E). Furthermore, in contrast to the Control group, detection of lipid ROS accumulation using the BODIPY 581/591 C11 probe showed that OxyHb treatment significantly accelerated the accumulation of lipid peroxides (P < 0.05; Figure 3F and G). Moreover, OxyHb treatment significantly suppressed GPX4 (P < 0.01), SLC7A11 (P < 0.05), and CoQ10B (P < 0.05) expression levels compared with the Control group (Figure 3H– K). Additionally, as compared with the Control group, OxyHb reduced BRD4 expression (P < 0.05; Figure 3H and L). Consequently, our findings indicate that BRD4 expression is downregulated, whereas ferroptosis-related pathways are activated, in HT-22 cells in response to treatment with OxyHb, consistent with our in vivo experimental observations.
Figure 4 | Inhibition of ferroptosis by Fer-1 alleviates neuronal death.
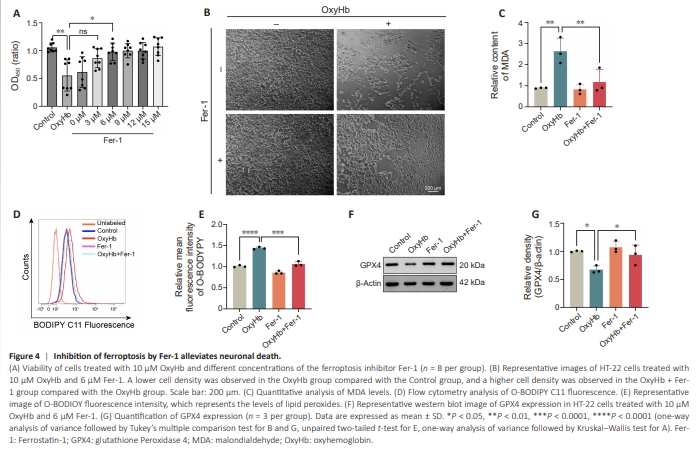
Given the results described above suggesting that ferroptosis may participate in neuronal death in mice with SAH, we postulated that inhibiting ferroptosis would alleviate neuronal death. To test this, we treated HT-22 cells with 10 μM OxyHb and 0 to 15 μM of Fer-1, a ferroptosis inhibitor (Miotto et al., 2020). CCK8 assay revealed that 3 μM Fer-1 ameliorated the decrease in cell viability induced by OxyHb, while 6 μM Fer-1 conferred the maximum benefit (Figure 4A). Therefore, 6 μM Fer-1 was used in subsequent in vitro experiments. Interestingly, consistent with the CCK8 assay, we found that the Fer-1 almost completely the decrease in HT-22 cell density induced by OxyHb compared with the OxyHb group, suggesting that ferroptosis is the most important neuronal death pathway activated by treatment with OxyHb (Figure 4B). In contrast to the OxyHb group, Fer-1 significantly decreased the accumulation of MDA induced by OxyHb (P < 0.01; Figure 4C). BODIPY (581/591) C11 staining followed by flow cytometry showed that treatment with Fer-1 significantly reduced lipid peroxidation in cells exposed to OxyHb (P < 0.001; Figure 4D and E). Moreover, as shown in Figure 4F and G, compared with the OxyHb group, Fer-1 treatment significantly rescued the downregulation in GPX4 expression caused by OxyHb (P < 0.05). Taken together, these results suggest that Fer-1 improves neuronal survival after OxyHb treatment by suppressing ferroptosis.
Figure 5 | BRD4 knockdown promotes ferroptosis in HT-22 cells treated with OxyHb.
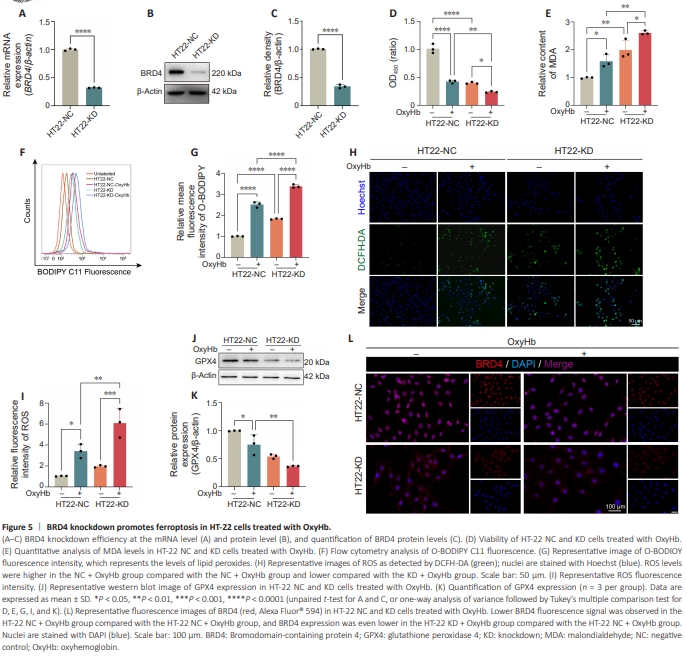
We next used an shRNA lentivirus to knock down BRD4 gene expression in HT-22 cells. The knockdown efficiency reached about 75% at both the gene transcription (P < 0.0001) and the protein expression level (P < 0.0001) (Figure 5A–C). Surprisingly, CCK8 assay showed that BRD4 knockdown significantly decreased cell viability not only in cells treated with OxyHb (P < 0.01) but also in untreated cells (P < 0.0001), compared with the respective control groups (Figure 5D). MDA analysis demonstrated a notable accumulation of lipid peroxides in both the knockdown (KD) group and the KD + OxyHb group in comparison with the respective control groups (P < 0.01; Figure 5E). Consistent with the MDA assay results, flow cytometry analysis of BODIPY (581/591) C11 staining showed that BRD4 knockdown significantly increased lipid peroxide accumulation following OxyHb exposure compared with in control virus (NC) cells treated with OxyHb (P < 0.0001; Figure 5F and G). In addition, BRD4 knockdown increased ROS levels even further in cells exposed to OxyHb than in wild-type cells treated with OxyHb (P < 0.01; Figure 5H and I). Western blot analysis demonstrated that the GPX4 expression was significantly lower in the KD + OxyHb group than in the NC + OxyHb group (P < 0.05; Figure 5J and K). Furthermore, IF staining confirmed that the KD + OxyHb group exhibited considerably lower BRD4 expression levels compared with the NC + OxyHb group (Figure 5L). These findings suggest that BRD4 inhibits ferroptosis, and that knocking down BRD4 increases ferroptosis following OxyHb treatment.
Figure 6 | BRD4 knockdown promotes ferroptosis in HT-22 cells via ferritinophagy following treatment with OxyHb.
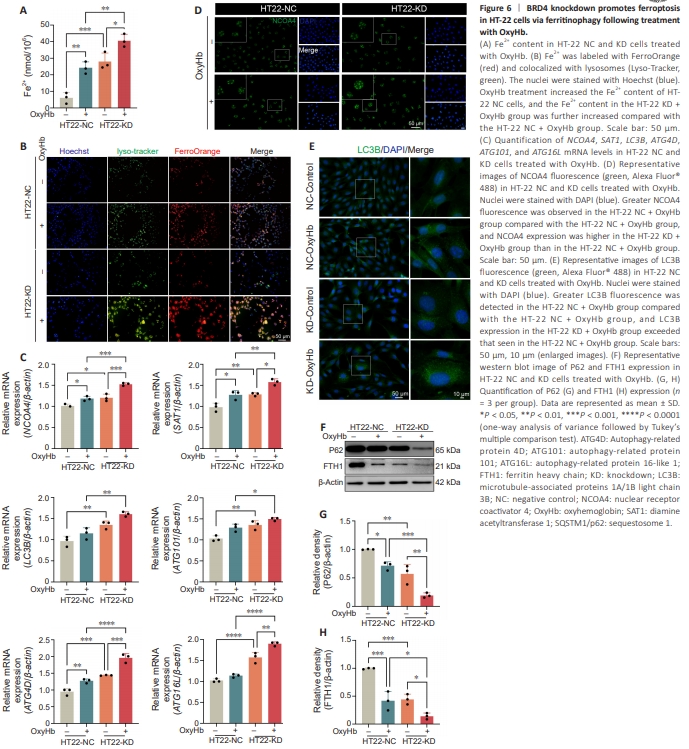
Given our finding that inhibiting BRD4 promotes ferroptosis, next we investigated the specific mechanism underlying this process. Because ferroptosis involves the accumulation of lipid peroxides, which is closely associated with iron overload (Tang et al., 2021), we first measured the iron content in HT-22 cells treated with OxyHb with or without BRD4 knockdown. The results showed that significantly greater iron accumulation in the KD + OxyHb group compared with the NC + OxyHb group (P < 0.01; Figure 6A). Using FerroOrange, a fluorescent probe that specifically detects iron ions (Fe2+) (Zuo et al., 2022), we found that OxyHb treatment triggered significant accumulation of Fe2+ compared with the NC-Control group. Notably, this accumulation was exacerbated by BRD4 knockdown. Importantly, FerroOrange staining colocalized with Lyso-Tracker, a lysosome marker, suggesting that BRD4 induces Fe2+ release through the lysosomal pathway (Figure 6B). Zhang et al. (2018) definitively established ferritinophagy as a potent trigger of ferroptosis. Thus, we speculated that BRD4 might regulate ferroptosis in HT22 cells via ferritinophagy. To test this, we assessed the expression of genes and proteins involved in iron metabolism in the presence or absence of BRD4 knockdown. Quantitative polymerase chain reaction analysis showed that BRD4 knockdown in cells treated with OxyHb induced the expression of ferroptosisassociated genes (NCOA4, P < 0.001; SAT1, P < 0.01) and autophagy-associated genes (LC3B, P < 0.01; ATG4D, P < 0.0001; ATG101, P < 0.05; ATG16L, P < 0.0001) in contrast to the NC + OxyHb group (Figure 6C). In addition, immunofluorescence staining indicated that BRD4 knockdown in cells treated with OxyHb significantly upregulated NCOA4 and LC3B protein expression levels compared with the NC + OxyHb group (Figure 6D and E). Western blot analysis showed that the expression of SQSTM1/p62, an autophagic cargo component, was lower in the KD + OxyHb group than in the NC + OxyHb group (P < 0.0001; Figure 6F and G). Moreover, compared with the NC-Control group, OxyHb treatment and BRD4 knockdown led to a decrease in FTH1 expression (P < 0.05; Figure 6F and H). Thus, BRD4 knockdown induces ferroptosis in HT-22 cells via ferritinophagy following treatment with OxyHb.
Figure 8 | BRD4 knockdown induces ferritinophagy in HT-22 cells through the Raf-1/ERK1/2 pathway.

To determine the role of Raf-1 in ferroptosis, HT-22 NC cells and KD cells were treated with the Raf-1 kinase inhibitor GW5074 (0, 1, 5, 10, 20, or 50 μM). GW5074 inhibited HT-22 cell growth in a dose-dependent manner; the 5 μM concentration was selected for use in subsequent experiments because it decreased cell viability by 50% (P < 0.0001; Figure 8A). MDA assay demonstrated that combined BRD4 knockdown and GW5074 treatment resulted in a notable lipid peroxide accumulation compared with the NC-GW5074 group, suggesting that the Raf-1 promoted ferroptosis (P < 0.01; Figure 8B). Staining indicated that the ferrous iron content of lysosomes in the KD-GW5074 group increased markedly in comparison with the NC-GW5074 group (Figure 8C). As shown in Figure 8D, qPCR analysis demonstrated marked upregulation of a ferroptosis-associated gene (FTH1, P < 0.001) and several autophagy-associated genes (LC3B, P < 0.01; ATG12, P < 0.05; ATG16L, P < 0.0001) in the KD-GW5074 group in contrast to the NC-GW5074 group. At the protein level, LC3B-II expression increased markedly (P < 0.05), and GPX4 (P < 0.0001), FTH1 (P < 0.05), and P62 (P < 0.05) expressions, as well as ERK1/2 phosphorylation (P < 0.0001), were significantly reduced in BRD4 knockdown cells treated with GW5074 compared with the NC-GW5074 group (Figure 8E–J). Although FTH1 mRNA expression increased after knock down BRD4, FTH1 protein expression decreased, which could be explained by activation of autophagy. IF staining further revealed that LC3B expression in the cytoplasm was notably higher in the KD-GW5074 group than in the NC-GW5074 group (Figure 8K). Therefore, BRD4 knockdown induced ferritinophagy in HT-22 cells through the Raf-1/ERK1/2 pathway.
Figure 9 | Neuron-specific BRD4 knockdown promotes neuronal ferroptosis after SAH.
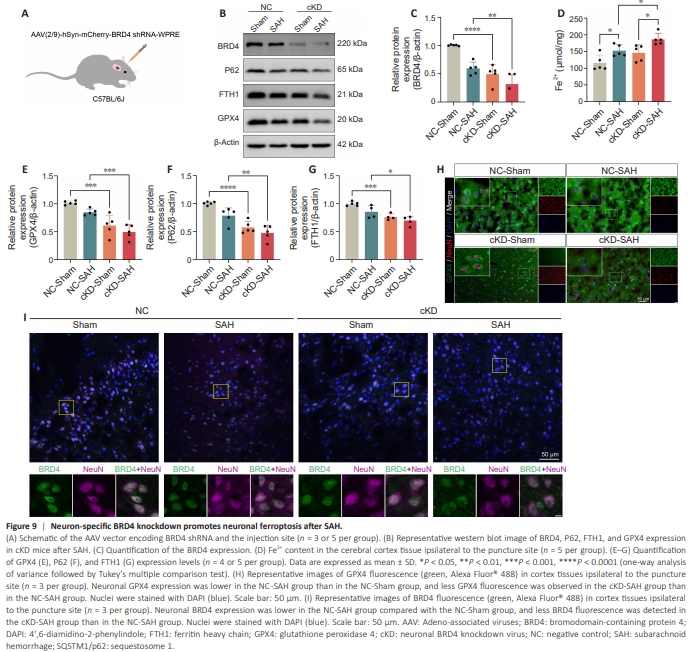
o investigate the role that neuronal BRD4 expression plays in SAH-induced EBI, we knocked BRD4 expression in mouse neurons via intraventricular injection of an AAV encoding a BRD4 shRNA controlled by a hSyn-specific promoter which is widely used as a neuron-specific expression element(Figure 9A). Mice injected with the AAV exhibited significantly decreased BRD4 expression in the cerebral cortex (P < 0.0001), and SAH further suppressed BRD4 expression in the cKD group compared with the NC group (P < 0.01; Figure 9B and C). Importantly, significant Fe2+ accumulation in the cerebral cortex was observed in the cKD group rather than NC group postSAH (P < 0.01; Figure 9D). Western blot showed that neuron-specific BRD4 knockdown in mice with SAH significantly suppressed GPX4 (P < 0.001), P62 (P < 0.01), and FTH1 (P < 0.05) expression levels in contrast to the NC - SAH group (Figure 9B and E–G). Additionally, IF staining confirmed that BRD4 and GPX4 expression in neurons was reduced in the cKD group compared with the NC group following SAH (Figure 9H and I). In conclusion, neuron-specific BRD4 knockdown promoted neuronal ferritinophagy, leading to neuronal ferroptosis, after SAH.