脑损伤
-
Figure 1 | Shh expression is upregulated in patients with cerebral ischemic injury.
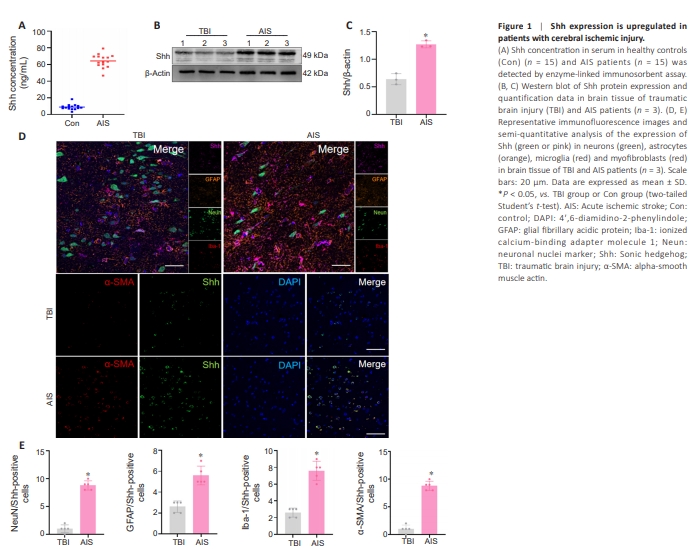
ELISA revealed that Shh concentration was increased in serum of 15 AIS patients compared with serum of 15 healthy controls (Figure 1A). Brain tissue samples from patients with acute brain injury and those with ischemic stroke can provide a more intuitive reflection of changes in relevant indicators in human brain tissue under normal and ischemic conditions, respectively. Western blotting analysis revealed a substantial upregulation in Shh expression in brain tissue in three AIS patients compared with three TBI patients (Figure 1B and C). Immunofluorescence analysis of human brain tissues revealed that Shh was significantly upregulated in AIS patients compared with TBI patients; Shh was widely expressed on microglia, neurons and astrocytes (Figure 1D). α-SMA serves as a marker for myofibroblasts (Huang et al., 2014). Shh/α-SMA-, Neun/Shh-, GFAP/Shh- and Iba-1/Shh-positive cells were significantly increased in the brain tissues of AIS patients compared with TBI patients (Figure 1D and E). These results suggest that cerebral ischemic injury upregulates Shh expression, especially in myofibroblasts.
Figure 2 | Shh expression is upregulated in the MCAO/R-induced fibrosis mouse model in vivo and TGF-β1-induced fibrosis model in vitro.
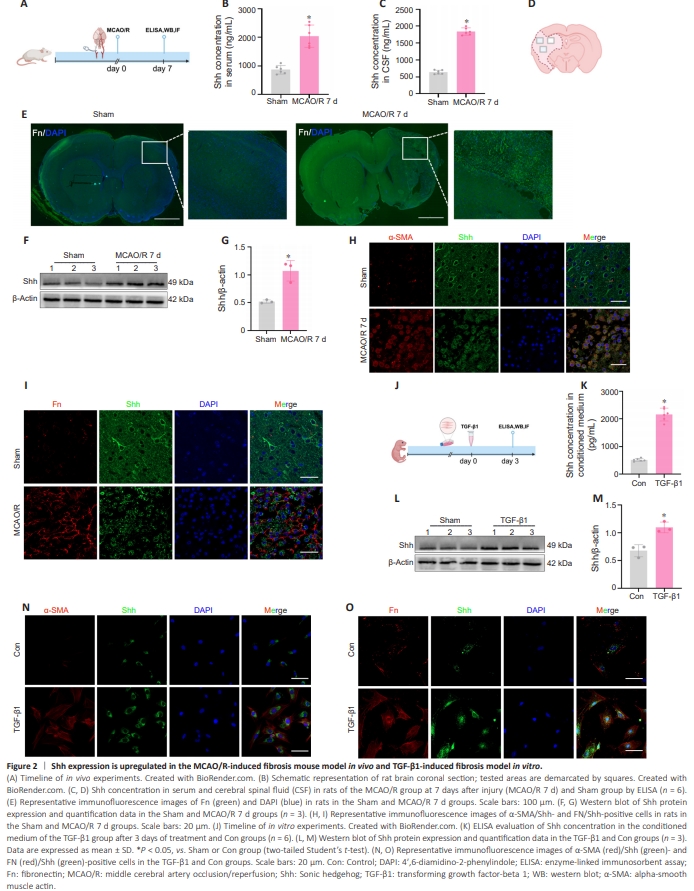
We observed a significant upregulation of Shh expression in AIS patients, particularly in myofibroblasts. Myofibroblasts are the primary effector cells for fibrosis formation after cerebral ischemic injury (Ayazi et al., 2022). We previously found that MCAO/R injury triggers the formation of fibrotic scars in the ischemic core areas of rats (Chen et al., 2023; Huang et al., 2023a; Li et al., 2024). To elucidate the effect of Shh on myofibroblasts, we established MCAO/R-induced fibrosis model in rats in vivo (Figure 2A and B). We established a MCAO/R rat model, a canonical model for eliciting focal cerebral ischemia in rodent studies (Ikeda et al., 2003), and assessed neurological deficits in the early post-ischemic phase. Among the 188 MCAO/R rats, 14 were excluded because of low neurological function scores. The overall mortality of MCAO/R rats was 10.63% (20/188). No rats in the sham group (n = 40) died. ELISA showed that Shh concentration in serum and cerebrospinal fluid were elevated in the MCAO/R group at 7 days after injury (MCAO/R 7 d) compared with the sham group (Figure 2C and D). Fn is an important component of the extracellular matrix and can serve as a marker for the occurrence of fibrosis (Huang et al., 2023b). Immunofluorescence staining showed that Fn expression in the ischemic area was significantly increased in the MCAO/R 7 d group compared with the corresponding region in the sham group (Figure 2E). Western blotting analysis also revealed Shh upregulation in the cerebral ischemic tissue in the MCAO/R 7 d group (Figure 2F and G). The α-SMA/Shh- and FN/Shh double-positive cells can serve as an indicator of the relationship between Shh signaling and fibrosis. Immunofluorescence staining showed that levels of α-SMA/Shh- and FN/Shh-positive cells in the ischemic area were significantly increased in the MCAO/R 7 d group compared with corresponding results in the sham group (Figure 2H and I).To examine the effect of Shh on myofibroblasts, we established TGF-β1-induced fibrosis model in fibroblasts (Figure 2J). ELISA and western blotting showed that Shh concentration in conditioned medium and Shh expression in fibroblasts were elevated in the TGF-β1 group compared with the Con group (Figure 2K–M). Immunofluorescence staining revealed an increase in α-SMA/Shh- and FN/Shhpositive cells in the TGF-β1 group compared with the Con group (Figure 2N and O). These results indicate that Shh expression was upregulated in the in vivo MCAO/R-induced fibrosis model and in vitro TGF-β1-induced fibrosis model.
Figure 3 | Overexpression of Shh promotes fibrotic scar formation and improves outcome after MCAO/R injury.
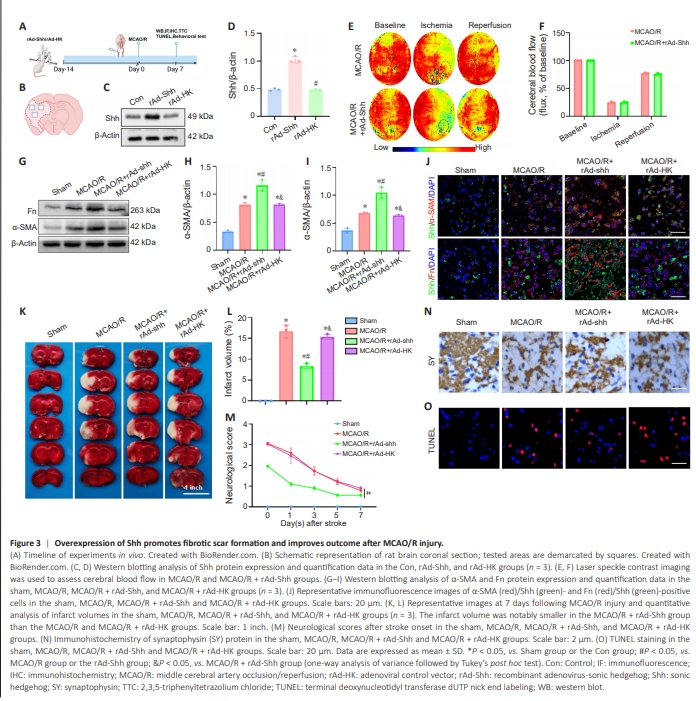
Our results demonstrated that MCAO/R injury induced the development of fibrotic scar and upregulated the expression of Shh in the ischemic cerebral hemisphere of rats. Therefore, we next explored the effects of Shh overexpression by adenovirus (rAd-Shh) on the formation of fibrotic scars and functional recovery after MCAO/R injury (Figure 3A and B). Rats were injected with adenovirus 14 prior to model induction and evaluated 7 days after injury. Western blotting analysis confirmed upregulation of Shh expression in the rAd-Shh group compared with the Con and rAd-HK (adenovirus control vector) groups (Figure 3C and D). Laser speckle contrast imaging revealed a reduction in the right cerebral blood flow of rats post-MCAO, followed by an increase upon reperfusion; rAd-Shh treatment did not influence cerebral blood flow (Figure 3E and F). Western blotting and immunofluorescence staining showed that the expression of Fn and α-SMA proteins and α-SMA/Shh- and FN/Shhpositive cells were elevated in the MCAO/R, MCAO/R + rAd-shh and MCAO/R + rAd-HK groups compared with the Sham group (Figure 3G–J). Notably, levels were higher in the MCAO/R + rAd-Shh group compared with the MCAO/R and MCAO/R + rAd-HK groups. It has been verified that overexpression of Shh can promote the formation of fibrosis in the ischemic core region in the early phase after MCAO/R. We next examined whether overexpression of Shh exerted neuroprotective effects. Shh overexpression decreased infarct volume (Figure 3K and L), improved neurological deficits (Figure 3M), increased synaptophysin (Figure 3N) and reduced the number of apoptotic cells (Figure 3O), compared with observations in the MCAO/R and MCAO + rAd-HK groups. These findings suggested that overexpression of Shh promotes fibrotic scar formation and improves outcomes after MCAO/R injury.
Figure 4 | Shh overexpression and SAG promote fibroblast activation in vitro.
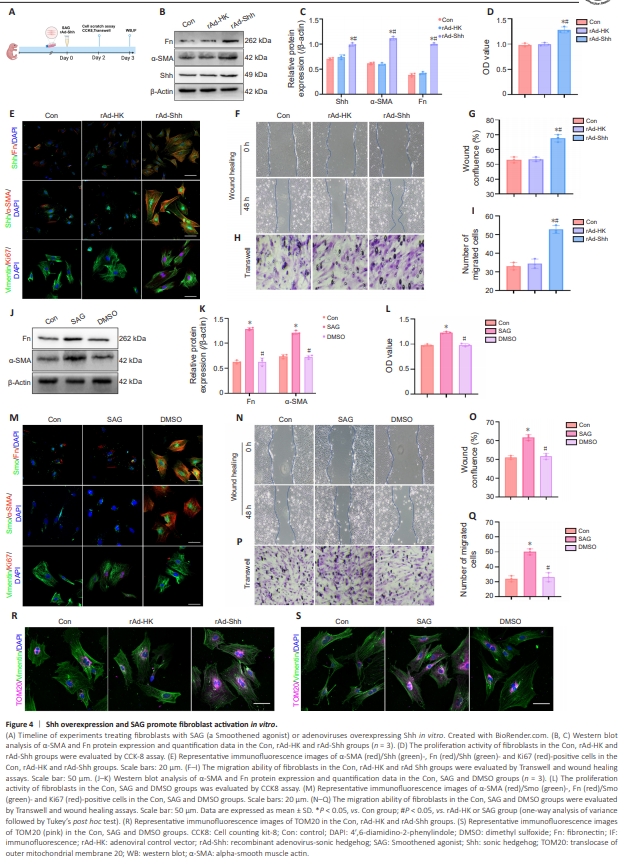
Overexpression of Shh promotes fibrotic scar formation in rats after MCAO/ R. However, the role of Shh signaling in the activation of meningeal fibroblasts remains unclear. We next examined the role of Shh signaling in the activation of fibroblasts in vitro by Shh overexpression by adenovirus or treatment with SAG (a potent agonist of the Shh signaling pathway) (Figure 4A). Western blotting showed that the expression of Shh, Fn and α-SMA proteins wereelevated in the rAd-Shh and SAG groups compared with the Con, rAd-HK and DMSO groups (Figure 4B, C, J, and K). CCK-8 assay revealed increased fibroblast proliferation after overexpression of Shh (Figure 4D and L). Immunofluorescence staining showed that the expressions of α-SMA/Shh-, FN/Shh-, α-SMA/Smo-, FN/Smo- and Ki67-positive cells were elevated in the rAd-Shh and SAG groups compared with the Con, rAd-HK and DMSO groups (Figure 4E and M). Wound healing and Transwell tests further showed that activation of Shh signaling promoted fibroblast migration (Figure 4F–I and N–Q). Immunofluorescence staining showed that the expression of TOM20 protein is increased in the rAd-Shh and the SAG groups compared with the Con, rAd-HK and DMSO groups (Figure 4R and S), which may be related to an increased volume in mitochondria. These findings indicate that activation of the Shh signaling pathway by Shh overexpression or SAG enhanced the proliferation and migration of meningeal fibroblasts and promoted meningeal fibroblasts to transition into myofibroblasts. Shh signaling regulates the expression of MFN2 in vitro and in vivo Mitochondria are the primary organelles for generating energy in cells and generate a large amount of adenosine triphosphate to provide energy for various cellular activities (Liesa and Shirihai, 2013; Giacomello et al., 2020). TOM20 is a mitochondrial marker and a key component of the outer mitochondrial membrane (Eldeeb et al., 2024). Immunofluorescence staining showed that TOM20 expression was increased in the rAd-Shh and SAG groups compared with the Con, rAd-HK, and DMSO groups (Figure 4R and S), which may be related to an increased volume of mitochondria.
Figure 5 | Shh signaling regulates the expression of MFN2 in vitro and in vivo.
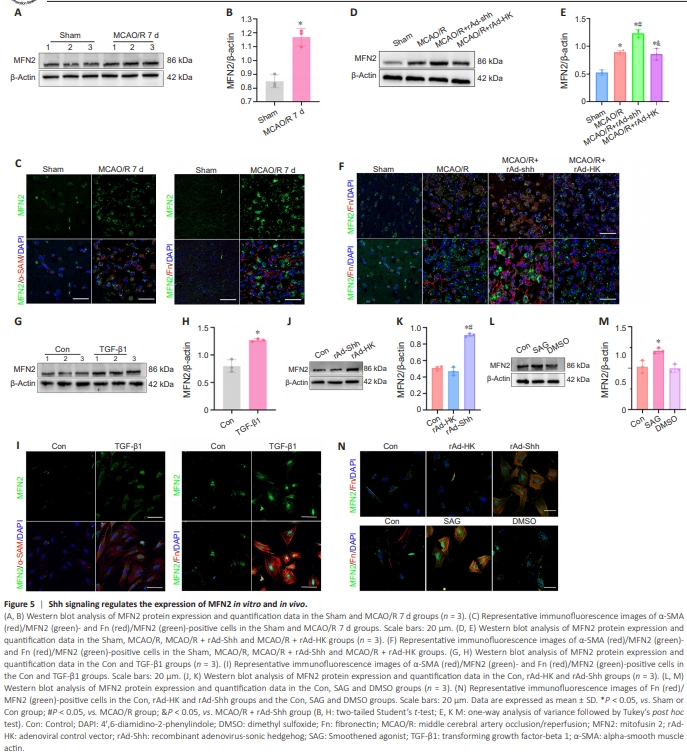
Our results suggest that Shh signaling may affect mitochondrial volume dynamics. MFN2, a key modulator of mitochondrial fusion events, plays a key role in mitochondrial volume dynamics (Liesa and Shirihai, 2013). We further explored whether Shh signaling regulates the expression of MFN2 in the MCAO/R models. Western blotting and immunofluorescence staining showed that MFN2-, α-SMA/MFN2- and Fn/MFN2- positive cells were elevated in the MCAO/R 7 d group compared with the Sham group, indicating elevated MFN2 levels in upon MCAO (Figure 5A–C). MFN2 was elevated in the MCAO/R + rAd-Shh, MCAO/R + rAd-HK and MCAO/R groups compared with the Sham group and at higher levels in the MAO/R + rAd-Shh group than in the MCAO/R and MCAO/R + rAd-HK groups (Figure 5D–F). These results from rats after MCAO/R demonstrate that the Shh signaling increases the expression of MFN2. Western blotting and immunofluorescence staining in meningeal fibroblasts indicated that MFN2 expression and α-SMA/MFN2- and Fn/MFN2-positive cells were elevated in the TGF-β1 group compared with the Con group (Figure 5G–I). These levels were elevated in the rAd-Shh and SAG groups compared with the Con, rAd-HK and DMSO groups (Figure 5J–N). These results demonstrate that the Shh signaling regulates the expression of MFN2 in vitro and in vivo, and promotes mitochondrial fusion in fibroblasts.
Figure 6 | Shh signaling regulates Smad3 phosphorylation.

Western blotting analysis showed that expression of Smad3 and P-Smad3 proteins gradually increased on day 3 after MCAO/R, reached maximum levels on day 7, and decreased on day 14 (Figure 6C–E). Western blotting and immunofluorescence staining showed that expression of P-Smad3 protein and α-SMA/P-Smad3- and Fn/P-Smad3-positive cells were elevated in the MCAO/R, MCAO/R + rAd-Shh and MCAO/R + rAd-HK groups compared with the Sham group (Figure 6F–I). These levels were higher in the MAO/R + rAd-Shh group than the MCAO/R and MCAO/R + rAd-HK groups. The expression levels of Smad3 protein were not significantly different between the experimental groups. The aforementioned results demonstrate that MCAO/R can enhance the expression of both Smad3 and P-Smad3. However, the Shh signaling pathway influences only the phosphorylation of Smad3, without significantly affecting the overall expression levels of Smad3. In meningeal fibroblasts, the expressions of P-Smad3 and α-SMA/P-Smad3- positive cells were elevated in the rAd-Shh and SAG groups compared with the Con, rAd-HK and DMSO groups (Figure 6J–Q). No significant differences were observed in Smad3 protein across the various groups. These in vitro and in vivo results indicate that the Shh signaling regulates Smad3 phosphorylation without significantly affecting the overall expression levels of Smad3. We next used the Gepia2 database to analyze the correlation of Shh, Smad3 and MFN2 in human brain tissues (excluding cerebellum and spinal cord). The analysis revealed notable correlations between Shh and Smad3, Shh and MFN2, and Smad3 and MFN2, with Pearson correlation coefficients of 0.57, 0.70 and 0.66, respectively (Figure 6A). The correlation heatmap of Shh, MFN2 and Smad3 is shown in Figure 6B. We thus speculated that Shh signaling may regulate MFN2 expression via P-Smad3.
Figure 7 | Augmenting Smad3 phosphorylation upregulates MFN2 expression.
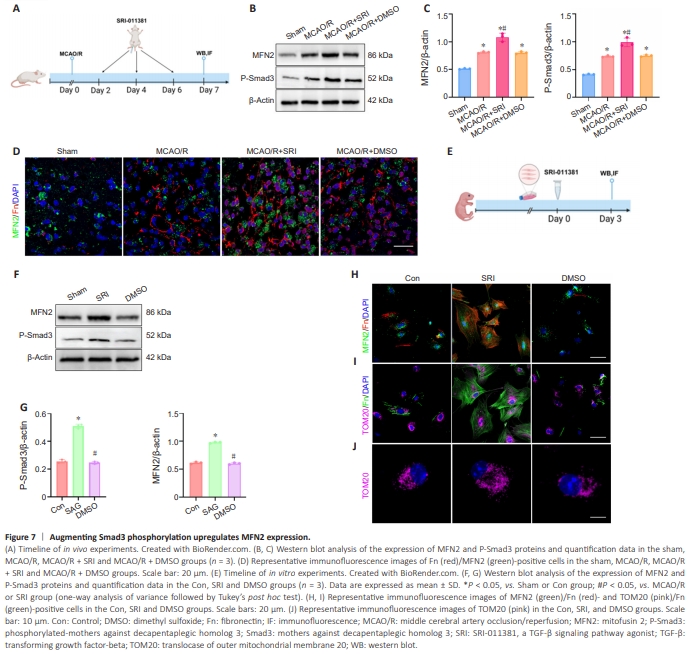
We next explored whether phosphorylated Smad3 regulated MFN2 expression using SRI-011381 (an agonist of the TGF-β signaling pathway) to augment Smad3 phosphorylation in vitro and in vivo (Figure 7A and E). Western blotting confirmed higher P-Smad3 levels in the MCAO/R + SRI and SRI groups compared with the MCAO/R, MCAO/R + DMSO and DMSO groups, indicating that SR-011381 promoted the phosphorylation of Smad3 (Figure 7B, C, F, and G). Western blotting and immunofluorescence staining showed that expressions of MFN2 protein and Fn/MFN2 positive cells were elevated in the MCAO/R, MCAO/R + SRI, MCAO/R + DMSO groups compared with the Sham group. Moreover, they were elevated to higher levels in the MAO/R + SRI group compared with the MCAO/R and MCAO/R + DMSO groups (Figure 7B–D). In meningeal fibroblasts, the expressions of MFN2 protein and Fn/ MFN2-positive cells were higher in the SRI group compared with the Con and DMSO groups (Figure 7F–H). Moreover, expressions of TOM20/Fn-positive cells and TOM20 protein were elevated in the SRI group compared with the Con and DMSO groups (Figure 7I and J). These results from in vitro and in vivo studies indicate that augmenting Smad3 phosphorylation upregulates MFN2 expression
Figure 8 | Inhibiting Smad3 phosphorylation diminishes upregulated-effect of Shh signaling activation on MFN2 expression.
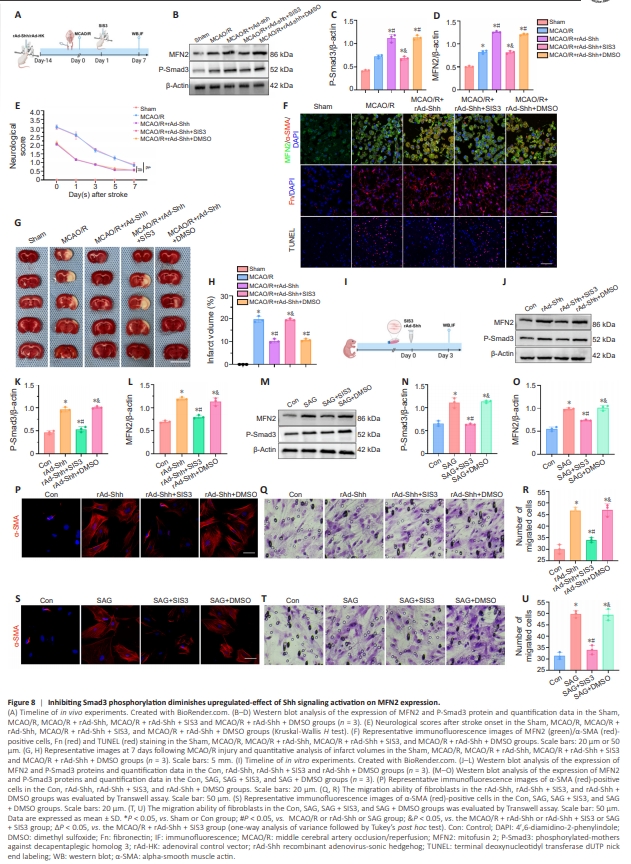
Finally, we determined whether Shh signaling modulated MFN2 expression by regulating Smad3 phosphorylation through the use of SIS3, a Smad3 phosphorylation inhibitor (Figure 8A and I). Western blotting showed that the expression of P-Smad3 in the MCAO/R + rAd-Shh + SIS3 group was lower than that in MCAO/R + rAd-Shh and MCAO/R + rAd-Shh + DMSO groups. Moreover, the expression of P-Smad3 was lower in the rAd-Shh + SIS3 and SAG + SIS3 groups compared with the rAd-Shh + DMSO and SAG + DMSO groups. As previously described, the levels of P-Smad3 expression are markedly elevated after MCAO/R, and overexpression of Shh can further increase the expression of P-Smad3, but the expression of P-Smad3 in the MCAO/R + rAdShh + SIS3 group was lower than that in MCAO/R + rAd-Shh and MCAO/R + rAd-Shh + DMSO groups confirming that SIS3 inhibited the phosphorylation of Smad3 successfully (Figure 8B, C, J, K, M, and N). Western blotting and immunofluorescence staining showed that expressions of MFN2 protein, α-SMA/MFN2-positive cells, and Fn protein were elevated in the MCAO/ R, MCAO/R + rAd-Shh and MCAO/R + rAd-Shh + DMSO groups compared with the Sham and MCAO/R + rAd-Shh + SIS3 groups (Figure 8B, D, and F). Moreover, blockade of Smad3 phosphorylation increased neurological deficits (Figure 8E), number of apoptotic cells (Figure 8F) and infarct volume (Figure 8G and H) compared with results in the MCAO/R + rAd-Shh and MCAO/R + rAd-Shh + DMSO groups. In meningeal fibroblasts, western blotting and immunofluorescence staining showed that the expressions of MFN2 protein and α-SMA-positive cells were elevated in the rAd-Shh, rAd-Shh + DMSO, SAG and SAG + DMSO groups compared with the Con, rAd-Shh + SIS3 and SAG + SIS3 groups (Figure 8J, L, M, O, P, and S). Cell migration was elevated in the rAd-Shh, rAd-Shh + DMSO, SAG and SAG + DMSO groups compared with the Con, rAd-Shh + SIS3 and SAG + SIS3 groups (Figure 8Q, R, T, and U). These results demonstrate that inhibiting Smad3 phosphorylation reduces the effects of Shh signaling activation on MFN2 expression.