神经退行性病
-
Figure 1 | Axon amyloidosis and enlargement are important pathological phenotypes in AD.
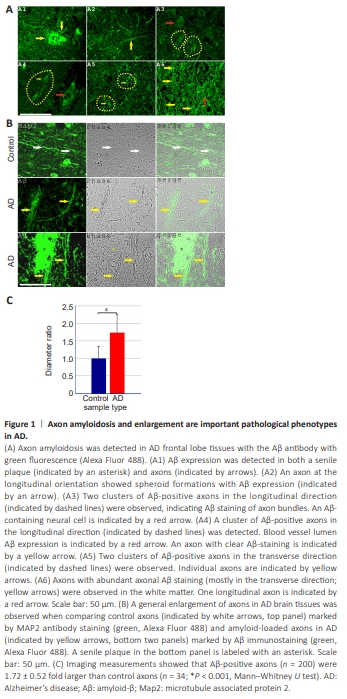
In our previous work, we detected Aβ staining in senile plaques, cerebral amyloid angiopathy, neurons, and red blood cells (Fu et al., 2023, 2024). After careful re-examination of the Aβ staining patterns of AD brain sections under optimized staining conditions and longer exposure settings, we observed clear axon-specific Aβ staining patterns that were not detected previously (two overview images of Aβ staining of AD tissue axons in longitudinal and transverse orientations are provided in Additional Figures 1 and 2). In the current study, we focused primarily on axon fragments in the gray matter or at the gray matter/white matter boundary, which may be defined as proximal axons that are close to the neuronal soma. We extended the analysis to axons in the white matter because many aspects of white matter axon fragments showed similar changes as the proximal axons. Figure 1A and Additional Figures 1 and 2 show that axon amyloidosis was widespread inAD brain tissues. Aβ immunostaining was distributed along the entire length of numerous axons. Aβ-positive axons were observed around senile plaques and in regions without senile plaques in the vicinity. Axonal amyloidosis was detected in axons in both longitudinal and transverse orientations. Furthermore, axons with Aβ staining were often observed as grouped clusters, which corresponded to the well-documented human cortical structural character of “axon bundles.” Axon bundles, also known as “axonal tracts” (van Groen et al., 2014; Katsuki and Hijioka, 2017), were frequently observed in Layer VI of the cerebral cortex, which comprises the gray matter/ white matter formation boundary. An image of MAP2-labeled axon bundles in the control brain is shown in Additional Figure 3. According to the literature, “axon bundles” derived from the neurons are the only neural cell process type that exhibits a “bundling” phenotype, different from astrocytic or microglial processes. These intracortical axon bundles had an average transverse diameter of 61.61 ± 9.88 μm (n = 11). Each bundle contained an average of 19.09 ± 4.61 axons (n = 11; Additional Figure 3). The enlarged and often bundled axons, but not unaffected axons, in AD brain tissues could be clearly identified via phase contrast microscopy owing to the enhanced contrast and darker appearance. These enlarged axons were not labeled with ionized calcium-binding adaptor molecule 1 (Iba1), a microglial marker, or glial fibrillary acidic protein (GFAP), an astrocyte marker (Additional Figure 4). Additionally, the enlarged axons could be identified with amyloid blue autofluorescence, an alternative marker of amyloidosis to Aβ antibody staining (Dowson, 1981; Gao et al., 2019), which we have previously referred to as “MetaBlue” (Fu et al., 2023, 2024). Blue autofluorescence is an intrinsic characteristic of Aβ homo- or hetero-oligomerization and is not abolished by copper sulfate quenching treatment. From cortical surface to white matter, we observed axon bundles at both transverse and longitudinal orientations within the same pathological section, which indicated different axon bundle populations (Additional Figures 1–3). Axon bundles were most clearly observed in Layer VI of the cortex, characterized by long axon fragments that bundled together. Puff-like spheroid formations were detected in a subset of Aβ-positive axons. Spheroids often form in regions with further-enhanced Aβ staining. Aβ-positive axons exhibit a general enlargement phenotype (Figure 1B), which is a basic characteristic that appears more frequently than spheroid formation. We measured the diameters of Aβ-positive axons in the transverse orientation outside of senile plaque regions because the strong plaque Aβ staining precluded accurate identification of Aβ-positive axons within senile plaques. These Aβ-positive proximal axons had an average diameter of 1.94 ± 0.59 μm (n = 200), whereas MAP2-labeled proximal axons from control frontal lobe samples measured 1.13 ± 0.39 μm (n = 34). Therefore, Aβ-positive axon diameters were 1.72 ± 0.52 fold larger than control axons (Mann-Whitney U test, P < 0.001). In addition, among the AD tissue axon samples, the mean Aβ staining intensity was weakly positively correlated with axon diameter (Spearman r = 0.338, P < 0.001, n = 200; Additional Figure 5), which further emphasizes the positive influence of Aβ on axonal enlargement. When axons in the white matter were analyzed, MetaBlue-positive amyloid-laden axon diameters were 3.80 ± 0.69 μm (n = 100), which indicated even greater enlargement than proximal axons in the gray matter or at the gray matter/ white matter boundary. Our data suggest that Aβ-amyloidosis-associated axonal enlargement is a basic pathological phenotype of AD.
Figure 2 | Axons in AD frontal brain tissues show a decrease in axonal structural protein MAP2.
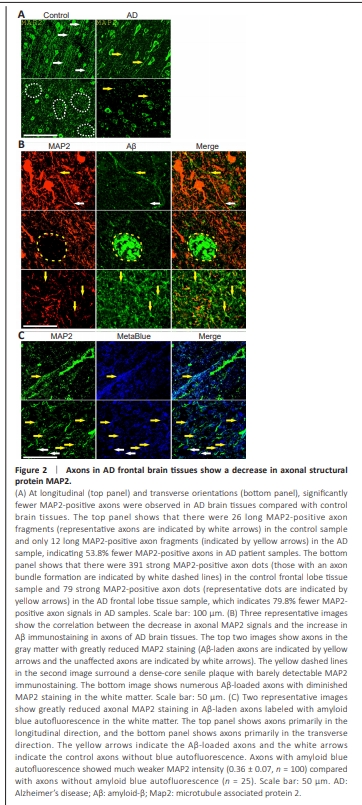
To examine the effect of axon amyloidosis on neurons, brain sections of AD patients were stained with an antibody against MAP2, a microtubuleassociated structural protein highly expressed in the neuronal soma, dendrite, and axon. Immunostaining of the AD and control brain sections showed strong MAP2 staining of the neuronal soma and axons and clear expression in the Layer VI axon bundles and white matter axons (Figures 1 and 2 and Additional Figure 3). This demonstrates that MAP2 is a useful marker for axons in human brain pathology studies. Figure 2A (top panel) shows that there were significantly fewer signals of MAP2-stained axons (i.e., MAP2-positive axon numbers decreased by more than half, with a reduction rate of 53.8%, when examining from the longitudinal orientation). Moreover, counting from the transverse orientation, we observed an even larger reduction of 79.8% in axon MAP2 signals (bottom panel of Figure 2A). Double immunostaining with an Aβ antibody showed that MAP2 expression correlated inversely with Aβ staining in AD tissue axons (Figure 2B). In the white matter tissue of AD patients, many axons exhibited a decrease in MAP2 protein while bearing significant Aβ staining. MAP2 staining on Aβ-positive axons was often fragmented and diffuse. Typically, there is very little MAP2 immunostaining within dense-core senile plaques. We also observed reduced MAP2 expression in amyloid-laden axons in the white matter when we used amyloid blue autofluorescence as an axon amyloidosis marker (Figure 2C). We estimated that, on the basis of one set of experiments, Aβ immunohistochemistry labeled 44.2% of proximal axons (we counted the average number of Aβ-labeled axons per axon bundle at the transverse orientation [8.44 ± 4.10, n = 16] and divided by the average axon bundle axon number of 19.09 in control samples obtained earlier). These data suggested that nearly half of all axons were affected by Aβ amyloidosis. Axons with amyloid blue autofluorescence showed much weaker MAP2 intensity (0.36 ± 0.07, n = 100) than axons without amyloid blue autofluorescence (n = 25). The amyloid-laden axons lost MAP2 expression at an average rate of 64% in white matter. Aside from the decrease in the MAP2 protein in axons, we observed reduced MAP2 immunostaining intensity in the soma in neurons with intracellular Aβ (Additional Figure 6), which suggests that Aβ has a deleterious effect on MAP2 expression in both axons and cell bodies.
Figure 3 | Lysosomal destabilization is common in AD frontal lobe tissues.
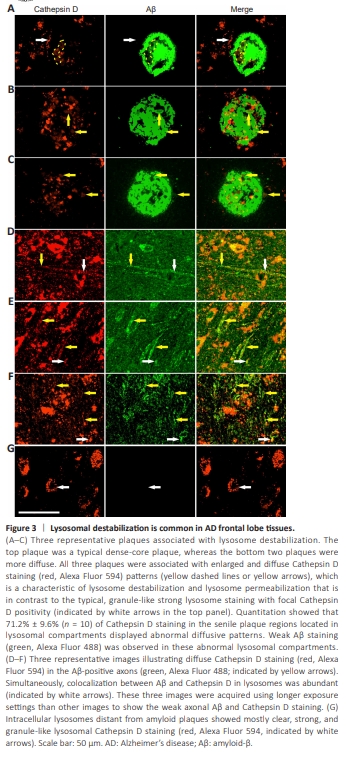
We hypothesized that the decrease in the MAP2 protein in axons was due to faulty protein degradation events, although other mechanisms, such as MAP2 messenger RNA transcription reduction or protein synthesis deficiency, are also possible. Lysosome and proteasome pathways are major pathways of protein degradation. Because we observed that Aβ-positive axons appeared to contain many vesicles, we stained the sections with a lysosomal enzyme marker Cathepsin D. Although we previously identified weak extracellular Cathepsin D staining codistributing with senile plaque Aβ aggregates, we alsoobserved clear intracellular neuronal lysosome Cathepsin D staining (Fu et al., 2023). However, neuronal Cathepsin D staining was not homogeneous. Rather, abnormal Cathepsin D staining was observed frequently in senile plaque regions (Figure 3A–C). Normal lysosomal staining showed granule-like patterns with strong Cathepsin D signals. By contrast, in senile plaques, 71.2% ± 9.6% (n = 10) of Cathepsin D staining resided in lysosomal compartments showing abnormal Cathepsin D staining with enlarged, diffuse, and weak staining patterns, which indicated lysosomal destabilization, as reported previously (Takahashi et al., 2002; Liu et al., 2010; Zaretsky et al., 2022). We did observe a weak yet detectable Aβ staining in these abnormal lysosomal compartments. The lysosomal compartments (including all Cathepsin D-labeled compartments) within the senile plaques measured 4.32 ± 1.99 μm (n = 122) in size, which was 3.65 ± 1.68 times larger (Mann–Whitney U test, P < 0.001) than the control lysosomes outside of plaque regions (1.18 ± 0.39 μm, n = 60); moreover, these were characterized by considerably weaker Cathepsin D staining intensity (0.76 ± 0.3; Mann–Whitney U test, P < 0.001). In AD tissue axons, Aβ and lysosomal enzyme marker Cathepsin D were highly colocalized with a tM1 value (for Aβ) of (0.852 ± 0.106, n = 8), indicating the predominant presence of axonal Aβ in the lysosomes. We also detected diffuse and weak Cathepsin D staining patterns along the length of Aβ-positive axons, which suggested the occurrence of axonal lysosome destabilization (Figure 3D–F). Control cellular lysosomes distant from senile plaques had primarily strong, clear, and granule-like Cathepsin D staining patterns (Figure 3G). Additional evidence showing axonal amyloidosis associated with unusually diffuse Cathepsin D staining is presented in Additional Figure 7, where we used amyloid blue autofluorescence as an amyloidosis marker. However, lysosome destabilization was not limited to axons. On closer inspection of the intracellular lysosomes, many neural cells also revealed heterogeneous Cathepsin D staining patterns (Figure 4). In summary, the destabilized lysosomes may be related to a decrease in the MAP2 protein in axons in patients with AD.
Figure 4 | Lysosomal destabilization is strongly associated with Aβ in the cell bodies of neural cells in AD frontal lobe tissues

Lysosomes are abundant in the neuronal soma. If lysosome destabilization occurs in regions surrounding senile plaques, we would expect to also detect destabilized lysosomes in cell bodies. Indeed, we observed frequent lysosomal destabilization in Aβ-containing neural cells (Figure 4 and Additional Figure 8). We use lysosomes from neural cells with limited Aβ staining as internal controls for unaffected lysosomes (Figure 4A). The control lysosomes appeared normal-looking with punctuate and compact staining of Cathepsin D. In cells with abundant Aβ signals, lysosomes became enlarged and clustered, and their Cathepsin D staining became diffuse. The enlargement of lysosomes filled with Aβ could be observed at the single lysosome level (yellow arrows in Figure 4B and C). Furthermore, the Aβ-loaded and enlarged lysosomes often clustered together to form large lysosomal domains with diffuse Cathepsin D staining (Figure 4D and E). Quantitation showed that 71.8% ± 13.8% (seven cells measured) of intracellular Aβ colocalized with Cathepsin D staining, which suggested that the majority of intracellular Aβ was in the lysosomes or destabilized lysosomes. The Aβ-containing lysosomes (n = 30) had an average size of 1.63 ± 0.27 μm, which was 2.23 ± 0.38 times as large (P < 0.001, t-test) and 0.32 ± 0.12 times of Cathepsin D intensity (P < 0.001, Mann–Whitney U test) as the control lysosomes with no Aβ staining (average size: 0.73 ± 0.09 μm, n = 12), which demonstrated that Aβ-associated lysosome destabilization is a distinctive phenotype of intracellular amyloidosis. The enlargement, clustering, and destabilization of Aβ-containing lysosomes may be related to the axonal enlargement observed in AD brain tissues. Aβ staining was also occasionally detected at extra-lysosomal locations in the cytoplasm and even the nucleus. We also observed occasional Cathepsin D staining in the nucleus (Figure 4F and G). The existence of Aβ and Cathepsin D in locations other than lysosomes may be related to lysosome destabilization and leakage; theoretically, in such conditions, lysosomal contents may be relocated to other cellular compartments. Additional Figure 9 shows the comparison between AD and non-AD neural cell lysosomes, again demonstrating the phenomenon of lysosome destabilization in AD neural cells.
Figure 5 | Blood and vascular proteins co-exist with intracellular Aβ in neural cells in AD frontal lobe tissues and may also be related to lysosome instability.
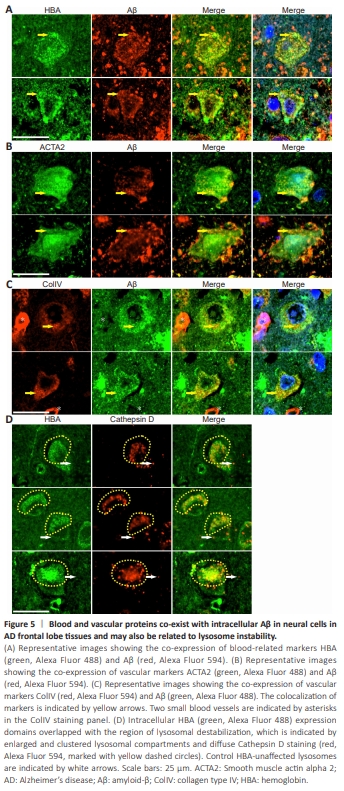
The above result further supports lysosome destabilization in AD as reported consistently in previous studies (Liu et al., 2010; Gowrishankar et al., 2015; Lee et al., 2022b; Zaretsky et al., 2022). However, whether abnormal lysosomes produce Aβ or Aβ induces lysosomal destabilization remains unclear. This complex question can be addressed by studying molecules that interact with Aβ. Previously, we established a link between Aβ senile plaque formation and intravascular hemolysis, vascular degeneration, and microaneurysm rupture (Fu et al., 2023, 2024). The relationship between microhemorrhageand Aβ senile plaque formation has also been explored by others (Miyakawa et al., 1982; Cullen et al., 2005, 2006; Stone, 2008; Chuang et al., 2012; Bu et al., 2018; Hecht et al., 2018). Thus, Aβ may interact either directly or indirectly with hemolysis or vascular markers, which would be reflected in the co-distribution of Aβ with hemolytic or vascular markers. We analyzed the intracellular co-expression of a hemolysis-related marker HBA and two vascular-related markers ACTA2 and ColIV with Aβ (Figure 5). All three markers showed good colocalization with intracellular Aβ in lysosome-like structures. HBA and ACTA2 signals, as well as Aβ signals, were also frequently observed in the nucleus (Figure 5A–C). Quantitative analysis showed that HBA, ACTA2, and ColIV colocalized with Aβ at rates of 82.3% ± 17.6% (n = 5), 78.4% ± 32.9% (n = 5), and 95.7% ± 8.0% (n = 5), respectively. When we performed HBA and Cathepsin D double-immunostaining on AD frontal lobe sections (Figure 5D), we observed the co-distribution of HBA signals with destabilized lysosomes, as indicated by enlarged and clustered lysosome compartments and diffuse Cathepsin D staining. Quantitative analysis showed that 43.2% ± 15.3% (n = 5) of intracellular HBA staining colocalized with Cathepsin D staining. These findings indicate that the protein partners that interact with Aβ (e.g., HBA) are also associated with lysosome destabilization in neural cells.
Figure 6 | Destabilized lysosomes are located in AD frontal lobe tissue dystrophic neurites, tangles, axons, and neuropil threads, and there was co-distribution between phos-tau and Aβ in dystrophic neurites, tangles, neuropil threads, and axons.
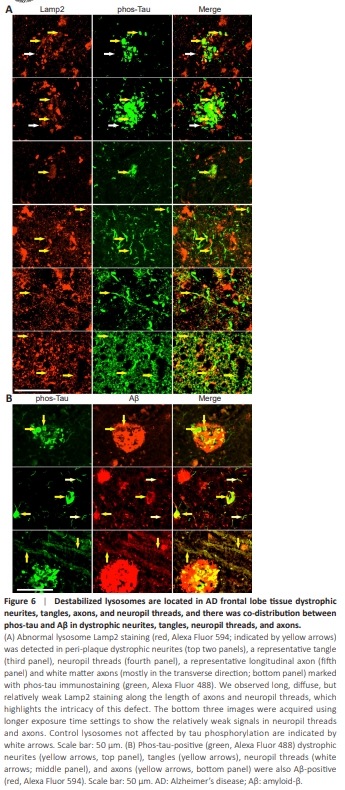
The results above clearly showed that there is a lysosome destabilization phenotype associated with intracellular Aβ in the neuronal cells in AD. Because we focused mainly on the axonal phenotype of AD in this study, to further verify whether destabilized lysosomes are linked to axonal degeneration, we stained the tissue sections with a phos-tau antibody, a wellknown axonal dystrophy marker in AD, and Lamp2, a lysosomal membrane marker. We observed the localization of abnormally diffuse lysosomal Lamp2 staining in phos-tau-positive dystrophic neurites, neurofibrillary tangles, axons, and neuropil threads (Figure 6A). Quantitative colocalization analysis showed that 45.4% ± 17.8% (n = 6) of Lamp2 staining colocalized with phostau staining in the senile plaque dystrophic neurites, whereas 62.9% ± 22.3% (n = 7) of Lamp2 staining colocalized with phos-tau staining in the neuropilthreads. Two additional images emphasizing the colocalization of Lamp2 and phos-tau staining in the dystrophic neurites in senile plaques are provided in Additional Figure 10. In addition, we detected an abundance of abnormally diffuse lysosomal Lamp2 staining in phos-tau-positive dystrophic axons in the white matter (Figure 6A, bottom panel). Neuropil thread is a collective term traditionally used for phos-tau staining in both axons and dendrites. We noticed that, throughout the brain, neuropil thread phos-tau staining was more abundant than phos-tau staining of tangles and senile plaque dystrophic neurites (Additional Figure 11). The phos-tau-positive neurites in AD tissues could be classified according to diameter as primary dystrophic neurites with an average diameter of 1.56 ± 0.37 μm (n = 40) or secondarydystrophic neurites with an average diameter of 0.40 ± 0.09 μm (N = 30), which may reflect the different size of axons and dendrites. When we stained the AD brain sections with both phos-tau and Aβ antibodies, we also detected colocalization between phos-tau and Aβ in dystrophic neurites, senile plaques, neurofibrillary tangles, neuropil threads, and axons (Figure 6B). Quantitative colocalization analysis showed that 34.4% ± 13.2% (n = 6) of Aβ staining colocalized with phos-tau staining in the senile plaques. However, Aβ staining intensity in the dystrophic neurites, tangles, and axons was lower than that in the senile plaques. These data confirm that axonal dystrophy is linked to Aβ, tau phosphorylation, and lysosome destabilization.
Figure 7 | Axon degeneration in AD bears the markers of hemorrhagic insults in AD frontal lobe tissues.

Why cells and axons in AD brain tissues degenerate remains unclear. The mechanism of lysosome destabilization was initially proposed following cell culture studies (Liu et al., 2010; Zaretsky et al., 2022). However, in vivo, Aβ alone may not be solely responsible for the degeneration effect because Aβ interacts with numerous other proteins. Given our previous finding that senile plaques are formed by blood Aβ leakage into the brain upon microaneurysm rupture, we hypothesized that axonal damage in AD brain tissues is also associated with various blood-related proteins. Therefore, we examined axonal pathology using a variety of blood- and plasma-related markers. Results showed that enlarged axons in AD brains indeed carried blood and plasma markers, such as ApoE, HBA, HbA1C, and hemin (Figure 7A–D). Overt acute hemorrhage rarely surrounded these affected axons, which suggested that the intake of hemorrhagic markers in these axons is likely a chronic event. The presence of blood markers in axons is not dependent on the proximity to senile plaques. In addition, the distribution of hemorrhagic markers is not always quantitatively proportional to the intensity of Aβ in AD brain tissues; there can be even stronger staining of hemorrhagic markers in the axons than in the surrounding senile plaques, which is likely due to the differential enrichment or metabolism of amyloid protein complexes in axons versus senile plaques (an example is provided in the top panel of Figure 7D showing more hemin staining in the axons than in the adjacent senile plaque). Moreover, axon amyloidosis was associated with Sortilin1 expression, an endosomal/lysosomal marker (Figure 7E), which has also been implicated as a major receptor for ApoE and a component of senile plaques (Carlo et al., 2013; Hu et al., 2017). Quantitative colocalization analysis showed that, in the axons, ApoE, HBA, HbA1C, hemin, and Sortilin1 colocalized with Aβ at ratios of 97.1% ± 3.6% (n = 12), 75.4% ± 9.5% (n = 8), 88.9% ± 5.0% (n = 8), 94.3% ± 9.9% (n = 11), and 94.9% ± 5.0% (n = 6), respectively. As shown in Figure 3, intracellular Aβ was predominantly detected in the lysosomes. Consistently, the above data suggest that intracellular ApoE, HBA, HbA1C, and hemin are also primarily located in the lysosomes. An overview image of widespread HBA and Aβ expression in the white matter axons is provided in Additional Figure 12. Additionally, when we stained the sections with red blood cellrelated histological stains (e.g., Alizarin red and rhodanine) (Fu et al., 2023), many axons in the AD brain tissues were also positively stained (Additional Figure 13). In fact, the white matter tissue of AD brains was broadly stained with Alizarin red and rhodanine, similar to HBA, demonstrating a strong effect of hemorrhagic markers on the white matter axons. Taken together, these findings indicate that the axons were enriched for not only Aβ but also numerous hemorrhage-related markers.
Figure 8 | Axonal breakages are occasionally observed in AD frontal lobe tissues.
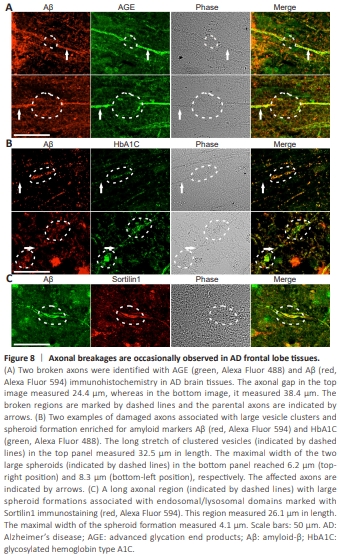
Whether axonal degeneration defects ultimately lead to axonal breakages in AD is a crucial question that needs addressing. We inspected hundreds of images containing Aβ-stained axons. Initially, we focused on axons inside senile plaques traveling in the longitudinal orientation because axons in the transverse orientation were difficult to identify individually. We observed that although many axons passing through the senile plaques were Aβ-positive and enlarged, they did not break (Additional Figure 14). However, we did find a few examples indicating that the axons were broken at locations outside of senile plaques. Using Aβ and AGE antibodies as markers for amyloidosisaffected axons, we were able to detect broken axons with gaps of up to 38.4 μm in width (Figure 8A). What caused these rare axonal breakages is not immediately clear. Additionally, we found that long stretches of amyloidloaded vesicles with large spheroid formations on the axons caused marked dystrophy, to a degree that axon morphology could no longer be recognized (Figure 8B). The long stretch of clustering vesicles with spheroid formations was likely due to lysosome clustering, as indicated by the endosome/ lysosomal marker Sortilin1 (Figure 8C). We speculate that in some cases, the continuous enlargement of destabilized lysosomal compartments across a long distance ultimately results in axonal breakages.