视神经损伤
-
Figure 1 | Distribution and abundance of sox10:tagRFP oligodendrocytes and Sox2-positive cells in the pre-ON of control and injured zebrafish.
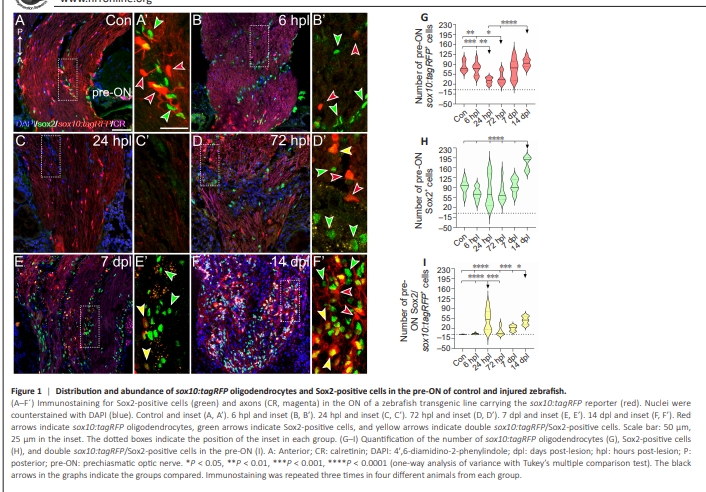
We first examined the general distribution of sox10:tagRFP oligodendrocytes and Sox2-positive cells (Sox2+ cells) in the zebrafish visual (Additional Figure 1). In the control retina (Additional Figure 1A and B), sox10:tagRFP oligodendrocytes were observed in the GCL (Additional Figure 1A and C) but not in the PGZ (Additional Figure 1B), and they extended into the ONFL close to the ONH (Additional Figure 1D). Typically, sox10:tagRFP oligodendrocytes were arranged in rows of several cells. Sox2 presented a wide distribution in the adult retina. All PGZ-treated cells were positive for Sox2 (Figure 1A and B). In the central retina, Sox2+ cells were found mainly in the INL and in the GCL (Additional Figure 1A–D). Some scattered Sox2+ cells were also detected in the inner plexiform layer (IPL), the ONFL, and the outer nuclear layer (Additional Figure 1C). In the ONH, sox10:tagRFP oligodendrocytes were arranged in rows of several cells (Additional Figure 1D). In contrast, very few Sox2+ cells were found in this area (Additional Figure 1D). In the ONH?ON transition zone (the region of the ON that consists of the transition between the ONH and the ON), we found sox10:tagRFP oligodendrocytes on the marginal sides of the ON, forming the glial limitans (Additional Figure 1E). Sox2+ cells were intermingled between these sox10:tagRFP cells. Finally, the rest of the ON (pre- and post-ON) presented sox10:tagRFP oligodendrocytes and Sox2+ cells dispersed all along (Additional Figure 1A, E and F). We could not detect any specific pattern of distribution, but sox10:tagRFP oligodendrocytes seemed to be in the interior of the ON, and Sox2+ cells were more marginally (Additional Figure 1E and F). Sox10:tagRFP oligodendrocytes were arranged in rows, but Sox2+ cells appeared solitarily. We did not find any co-localization between sox10:tagRFP and Sox2. Thus, sox10:tagRFP oligodendrocytes are usually found in well-differentiated areas of the nervous system, such as the mature retina, the ONH, and through all the ON to the optic tectum. Furthermore, Sox2, a marker for stem cells, is usually found in proliferative regions such as the PGZ and the exterior limits of the ON. Fully differentiated oligodendrocytes disappear from the point of injury To understand the behavior of fully differentiated oligodendrocytes (Sox10:tagRFP) and stem cells (Sox2+ ) during regeneration, we first examined their distribution in the area between the retina and the crushed point during regeneration (Figure 1). Immediately after damage, sox10:tagRFP oligodendrocytes and Sox2+ cells distributed in the ONH?ON transition zone (the region of the ON that consists of the transition between the ONH and the ON) were maintained in all experimental groups (Figure 1A?F). Sox2+ cells were intermingled between sox10:tagRFP oligodendrocytes on the margin of the ON, forming the glial limitans. After crush in the most anterior portion of the ON (pre-ON), sox10:tagRFP oligodendrocytes decreased from the injured area (Figure 1B and B’, quantified in Figure 1G; control versus 24 hpl: P < 0.001). At 24 hpl, the number of sox10:tagRFP oligodendrocytes reached its minimum, with fewer than 50 cells per section (Figure 1C and C’, quantified in Figure 1G; 6 hpl versus 24 hpl: P < 0.01). At 72 hpl, the number of sox10:tagRFP oligodendrocytes started to recover (Figure 1D and D’, quantified in Figure 1G; control versus 72 hpl: P < 0.01; 6 hpl versus 72 hpl: P < 0.05) and stabilized by 14 dpl, similar to the control (Figure 1E–F’, quantified in Figure 1G; 24 hpl and 72 hpl versus 14 dpl: P < 0.0001). Changes in the Sox2+ population were less dramatic. We did not detect any variations in the number of Sox2+ cells between 6 hpl and 7 dpl (Figure 1A–F’, quantified in Figure 1H). However, we observed a small decrease in the average number of Sox2+ cells between 6 and 72 hpl, which quickly recovered by 7 dpl (Figure 1H). In contrast, we detected an increase in Sox2+ cells at 14 dpl (Figure 1H; all groups versus 14 dpl: P < 0.0001). The 24 hpl timepoint seemed to be key for regeneration. We observed great variability in the number of Sox2+ cells, and sox10:tagRFP oligodendrocytes reached their lowest number. However, from this timepoint onward, we found double-positive cells for sox10:tagRFP and Sox2 (sox10:tagRFP/Sox2+ cells) at 24 hpl, 72 hpl, 7 dpl and 14 dpl (Figure 1D–F’, quantified in Figure 1I; control and 6 hpl versus 24 hpl: P < 0.0001). The highest level of colocalization was found at 24 hpl (Figure 1I), which likely reveals that OPCs differentiate into oligodendrocytes in situ. We also observed another key colocalization event at 14 dpl (Figure 1I; control and 6 hpl versus 14 dpl: P < 0.0001; 72 hpl versus 14 dpl: P < 0.001; 7 dpl versus 14 dpl: P < 0.05). These phenomena might be related to undifferentiated oligodendrocytes that repopulate the ON.
Figure 2 | Fluorescence intensity of sox10:tagRFP in ONs during regeneration.
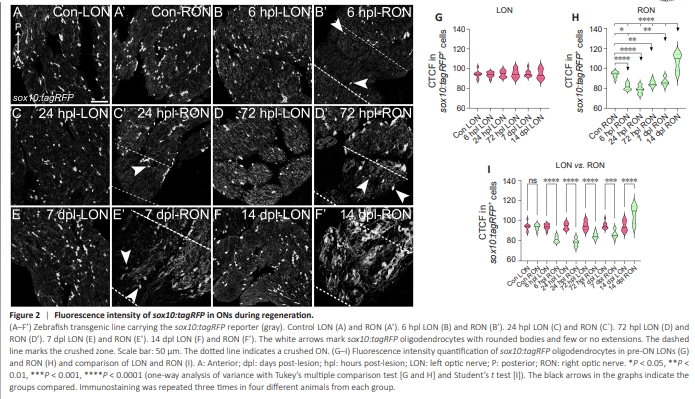
The reduction in sox10:tagRFP oligodendrocytes from injured ONs occurred simultaneously with cell morphological changes. Sox10:tagRFP oligodendrocytes that remain adjacent to the crush site lose their characteristic shape (Figure 1B’–E’), becoming rounded with fewer or no extensions. To further characterize this phenomenon, we quantified the fluorescence intensity of sox10:tagRFP oligodendrocytes in the preON area (Figure 2). At 6 hpl, in the injured right ON (RON), we observed a reduction in the sox10:tagRFP oligodendrocyte fluorescence intensity (Figure 2B’, quantified in Figure 2G; control versus 6 hpl: P < 0.0001). This reduction was maintained at 24 hpl (Figure 2C’, quantified in Figure 2G; control versus 24 hpl: P < 0.0001). By 72 hpl and 7 dpl, the sox10:tagRFP oligodendrocyte fluorescence intensity recovered and was closer to that of the control ON (Figure 2D’ and E’; quantified in Figure 2G; control versus 72 hpl: P < 0.01; control versus 72 dpl: P < 0.05). Finally, at 14 dpl, sox10:tagRFP oligodendrocyte fluorescence was more intense than that in control fish (Figure 2F’, quantified in Figure 2G; all groups versus 14 dpl: P < 0.0001). We also quantified the sox10:tagRFP fluorescence intensity in the left ON (LON) to compare it with that in the injured one (Figure 2A–F, quantified in Figure 2H, and compared to the RON in Figure 2I). We observed no changes in the fluorescence intensity of sox10:tagRFP oligodendrocytes in the uninjured ON (Figure 2H). The comparison between the oligodendrocytes of the injured and uninjured ON also confirmed the changes these cells underwent (Figure 2I; all timepoints except control LON versus RON: P < 0.0001). Therefore, ON crush alters the number and distribution of sox10:tagRFP oligodendrocytes in pre-ONs very early, but it does not alter the number or distribution of Sox2+ cells until several days later.
Figure 3 | Distribution and abundance of sox10:tagRFP oligodendrocytes and Sox2-positive cells in post-ON in control and injured zebrafish.
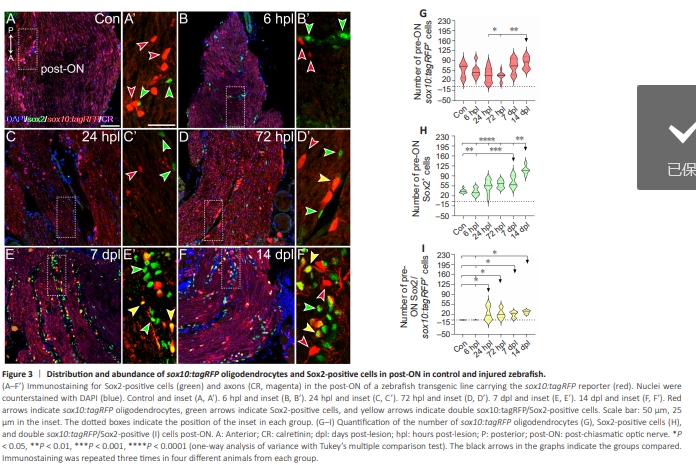
We wondered if the posterior portion of the ON, the one closer to the optic chiasm (post-ON), behaved similarly to the one closer to the retina. Indeed, we observed similar results with respect to the crushed area, with small differences (Figure 3). We also detected an early negative trend in fully differentiated oligodendrocytes (Figure 3B–D’, quantified in Figure 3G; 24 hpl versus 72 hpl: P < 0.05), which recovered by 14 dpl (Figure 3E–F’, quantified in Figure 3G; 72 hpl versus 7 dpl: P < 0.01). We also observed similar changes in the morphology of sox10:tagRFP oligodendrocytes, as they were rounder and had fewer or no extensions (Figure 3B’–C’). Sox2+ cells were significantly more abundant in post-ONs than in the control at 7 and 14 dpl (Figure 3B– F’, quantified in Figure 3H; control versus 7 dpl to control: P <0.001; control versus 14 dpl: P < 0.0001). Finally, the colocalization events in the postON group were very similar to those in the pre-ON group, and we detected double sox10:tagRFP/Sox2+ cells at 24 hpl, 72 hpl, 7 dpl, and 14 dpl (Figure 3D’–F’, quantified in Figure 3I, control versus 24 hpl, 72 hpl, 7 dpl and 14 dpl: P < 0.05).
Figure 4 | Distribution and abundance of sox10:tagRFP oligodendrocytes and Sox2- positive cells in the PGZ in control and injured zebrafish.
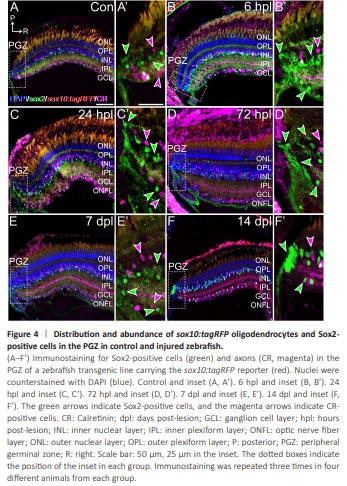
Retinal cells, mainly stem cells, Müller glia, and ganglion cells, also respond to injury (Stella et al., 2021). Thus, we explored whether there were any changes in the sox10:tagRFP and Sox2 populations after crush in the retina. Indeed, the stem cells located in the PGZ (Sox2+ ) quickly proliferate after injury (Figure 4A–B’). We observed an important increase in Sox2 staining, which was very evident at 6 hpl (Figure 4B and B’) and was maintained at least until 72 hpl (Figure 4C–D’). During this period, Sox2+ cells also extended further into themature retina (Figure 4B’). By 7 dpl, Sox2 staining in the PGZ decreased and was very close to that of the controls (Figure 4E and E’), and no differences were observed at 14 dpl (Figure 4F and F’), which is usually considered full recovery (Stella et al., 2021). We did not observe any fully differentiated oligodendrocytes (sox10:tagRFP) in the PGZ or close to it, and there were no changes during regeneration (Figure 4A–F). Thus, the newly formed oligodendrocytes necessary for regeneration did not arise directly from the PGZ.
Figure 5 | Distribution and abundance of sox10:tagRFP oligodendrocytes and Sox2-positive cells in the central retina of control and injured zebrafish.
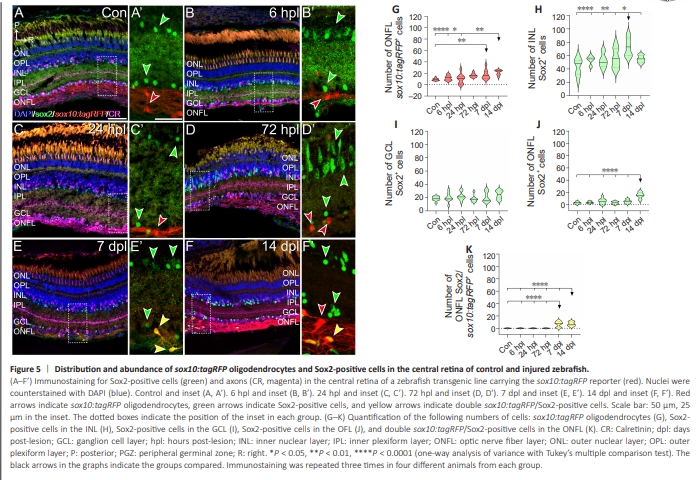
Our preliminary analysis revealed the presence of sox10:tagRFP cells in other retinal layers. Therefore, we wondered whether these cells also respond to ON damage. In the central retina (Figure 5), sox10:tagRFP oligodendrocytes were present in the GCL and extended into the ONFL (Figure 5A and A’). Most of the Sox2+ cells were found in the INL and in the GCL, some were in the IPL, and the ONFL presented the fewest (Figure 5A and A’). Thus, sox10:tagRFP oligodendrocytes and Sox2+ cells coexisted in the GCL and, mostly, in the ONFL. However, we did not find any colocalization between these markers in control animals (Figure 5A’, quantified in K). After ON crush, we did not observe any changes in the location of these cells, but we observed an increase in the number of both types of cells and, also, in the colocalization of the markers (Figure 5B–F’, quantified in Figure 5G–K). We found approximately 9 sox10:tagRFP oligodendrocytes per analyzed area distributed in the GCL and the ONFL (Figure 5A and A’, quantified in Figure 5G). We observed a slight but steady increase that peaked at 72 hpl, with 16 sox10:tagRFP oligodendrocytes per analyzed area (Figure 5D and D’, quantified in Figure 5G). By 7 dpl, the number of sox10:tagRFP oligodendrocytes was still high and similar to that at 72 hpl (Figure 5E, E’, quantified in Figure 5G; control versus 7 dpl: P < 0.01). Finally, at 14 dpl, we observed a further increase in the number of 21 sox10:tagRFP oligodendrocytes per section (Figure 5F and F’, quantified in Figure 5G; control versus 14 dpl: P < 0.0001). The number of Sox2+ cells also gradually increased throughout the time points studied in the INL (Figure 5A–F, quantified in Figure 5H), and their number at 7 dpl was the highest (Figure 5E and E’, quantified in Figure 5H; control versus 7 dpl: P < 0.0001; 6 hpl, 24 hpl and 27 hpl versus 7 dpl: P < 0.01; 14 dpl versus 7 dpl: P < 0.05). Although we observed some changes in the population of Sox2+ cells in the GCL and the ONFL, the variation was not significant, except in the ONFL at 14 dpl (Figure 5B–F, quantified in Figure 5I and J; all groups versus 14 dpl: P < 0.0001). Interestingly, we found double sox10:tagRFP/Sox2+ cells in the ONFL at 7 dpl and 14 dpl (Figure 5E–F’, quantified in Figure 5K; control, 6 hpl, 24 hpl and72 hpl versus 7 dpl: P <0.0001; control, 6 hpl, 24 hpl and 72 hpl versus 14 dpl: P <0.0001), which occurred later than in the ON (Figure 1). We could not find any other colocalization events in any other layer or at any of the other time points studied. These findings suggest that, under regenerative conditions, some Sox2+ OPCs in the ONFL are capable of differentiating into oligodendrocytes in the area where the ON starts.
Figure 6 | Distribution and abundance of sox10:tagRFP oligodendrocytes and Sox2-positive cells in the ONH of control and injured zebrafish.
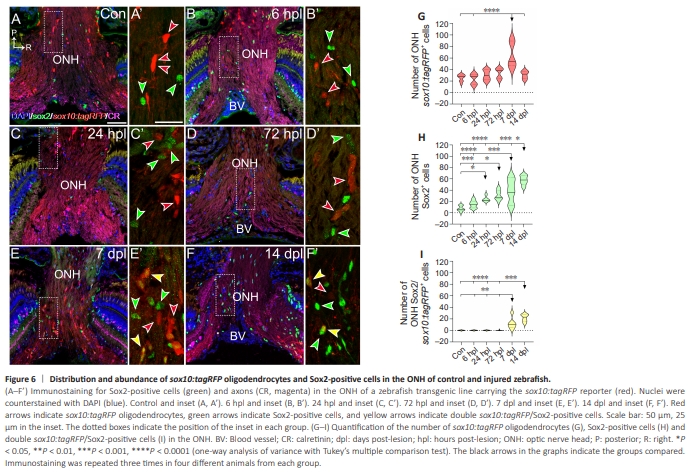
In the ONH, as in the mature retina, the number of sox10:tagRFP oligodendrocytes and Sox2+ cells increased after ON crush, but this change was observed earlier (Figure 6A–F, quantified in Figure 6G and H). The number of sox10:tagRFP oligodendrocytes in the ONH was similar to that in the control fish along the study but increased gradually (Figure 6A– F, quantified in Figure 6G). At 7 dpl, we observed many sox10:tagRFP oligodendrocytes (Figure 6E and E’, quantified in Figure 6G; control and 6 hpl versus 7 dpl: P < 0.0001). At 14 dpl, the number of sox10:tagRFP oligodendrocytes decreased, recovering to normal levels (Figure 6F and F’, quantified in Figure 6G; 14 dpl versus 7 dpl: P < 0.0001). At 6 hpl, Sox2+ cells were slightly more abundant in the regenerated fish than in the control fish, but this difference was not significant (Figure 6B and B’, quantified in Figure 6H). From that timepoint, the number of Sox2+ cells increased and peaked at 7 dpl (Figure 6E and E’, quantified in Figure 6H; control versus 7 dpl: P < 0.0001; 6 hpl versus 7 dpl: P < 0.001), which was consistent with the peak of sox10:tagRFP oligodendrocytes. This increase was maintained at 14 dpl (Figure 6F and F’, quantified in Figure 6H; control, 6 hpl, and 24 hpl versus 14 dpl: P < 0.0001; 72 hpl versus 14 dpl: P < 0.001; 7 dpl versus 14 dpl: P < 0.05). Interestingly, we found double sox10:tagRFP/Sox2+ cells at 7 dpl and 14 dpl, as we did in the central retina (Figure 6E–F’, quantified in Figure 6I; control, 6 hpl, 24 hpl and 72 hpl versus 7 dpl: P < 0.01; control, 6 hpl and 24 hpl versus 14 dpl: P < 0.0001; 72 hpl versus 14 dpl: P < 0.001).
Figure 7 | Distribution and abundance of TUNEL-positive cells and BrdU-positive cells in both ONs of control and regenerating zebrafish.
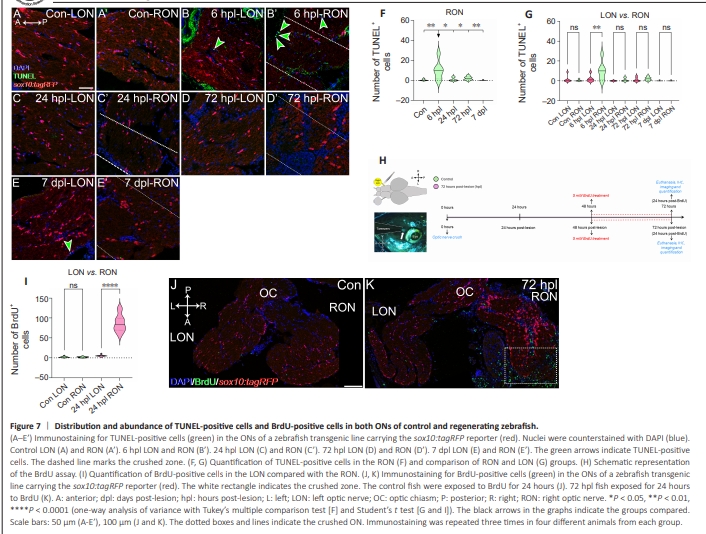
We reported that, after ON crush, there was a decrease in the number of sox10:tagRFP oligodendrocytes in the injured ON area, together with a loss of their characteristic morphology (cells with large soma and many extensions), resulting in round cells with few or no extensions (Figures 1 and 2). We wondered whether this reduction in the crushed area was due to cell death after ON degeneration. To test this hypothesis, we used the click-iTTM Plus TUNEL Assay Kit, which detects apoptotic cells in tissues in situ (Figure 7A–E’, quantified in F and G). We analyzed both ONs, the injured right ON (RON) and the uninjured left ON (LON). We found more apoptotic cells at 6 hpl in the RON (Figure 7B’, quantified in Figure 7F, and compared with LON in Figure 7G; control versus 6 hpl: P < 0.01; LON versus RON at 6 hpl: P < 0.01). However, these TUNEL-positive cells were negative for sox10:tagRFP, indicating that oligodendrocytes do not disappear by apoptosis and are positive for TUNEL. After ON crush, sox10:tagRFP cells recovered from 72 hpl, and the Sox2+ cell number was maintained in the injured ON area until 14 dpl (Figure 1). We also described the presence of double sox10:tagRFP/Sox2+ cells at 24 hpl, 72 hpl, 7 dpl, and 14 dpl. We performed an assay with BrdU, which allows an almost total substitution (99.8%–100%) of the thymidine nucleotides in cells in the S phase of the cell cycle. For this experiment (Figure 7H), we used control fish and 72 hpl fish, since we observed a recovery in the number of sox10:tagRFP oligodendrocytes in the injured ON during this time. Therefore, 24 hours before 72 hours after injury, we administered a fresh solution of 5 mM BrdU diluted in the tank. At the same time, control fish were administered a fresh solution of 5 mM BrdU diluted in tank water for 24 hours (Figure 7H). The control fish presented some proliferating cells, both in the RON and the LON (Figure 7J, quantified in Figure 7I). At 72 hpl, we observed many proliferating cells, especially in the crushed ON area and in the ON-injured area itself (Figure 7K, quantified in Figure 7I; LON versus RON: P < 0.0001). These BrdU+ cells were not positive for sox10:tagRFP. Thus, the oligodendrocytes that remain after injury do not give rise to more oligodendrocytes. The newly incorporated cells detected from 72 hpl onward are probably formed by the double sox10:tagRFP/Sox2+ we identified first in the injured area (Figure 1) and later in the retina (Figure 5 and 6).